
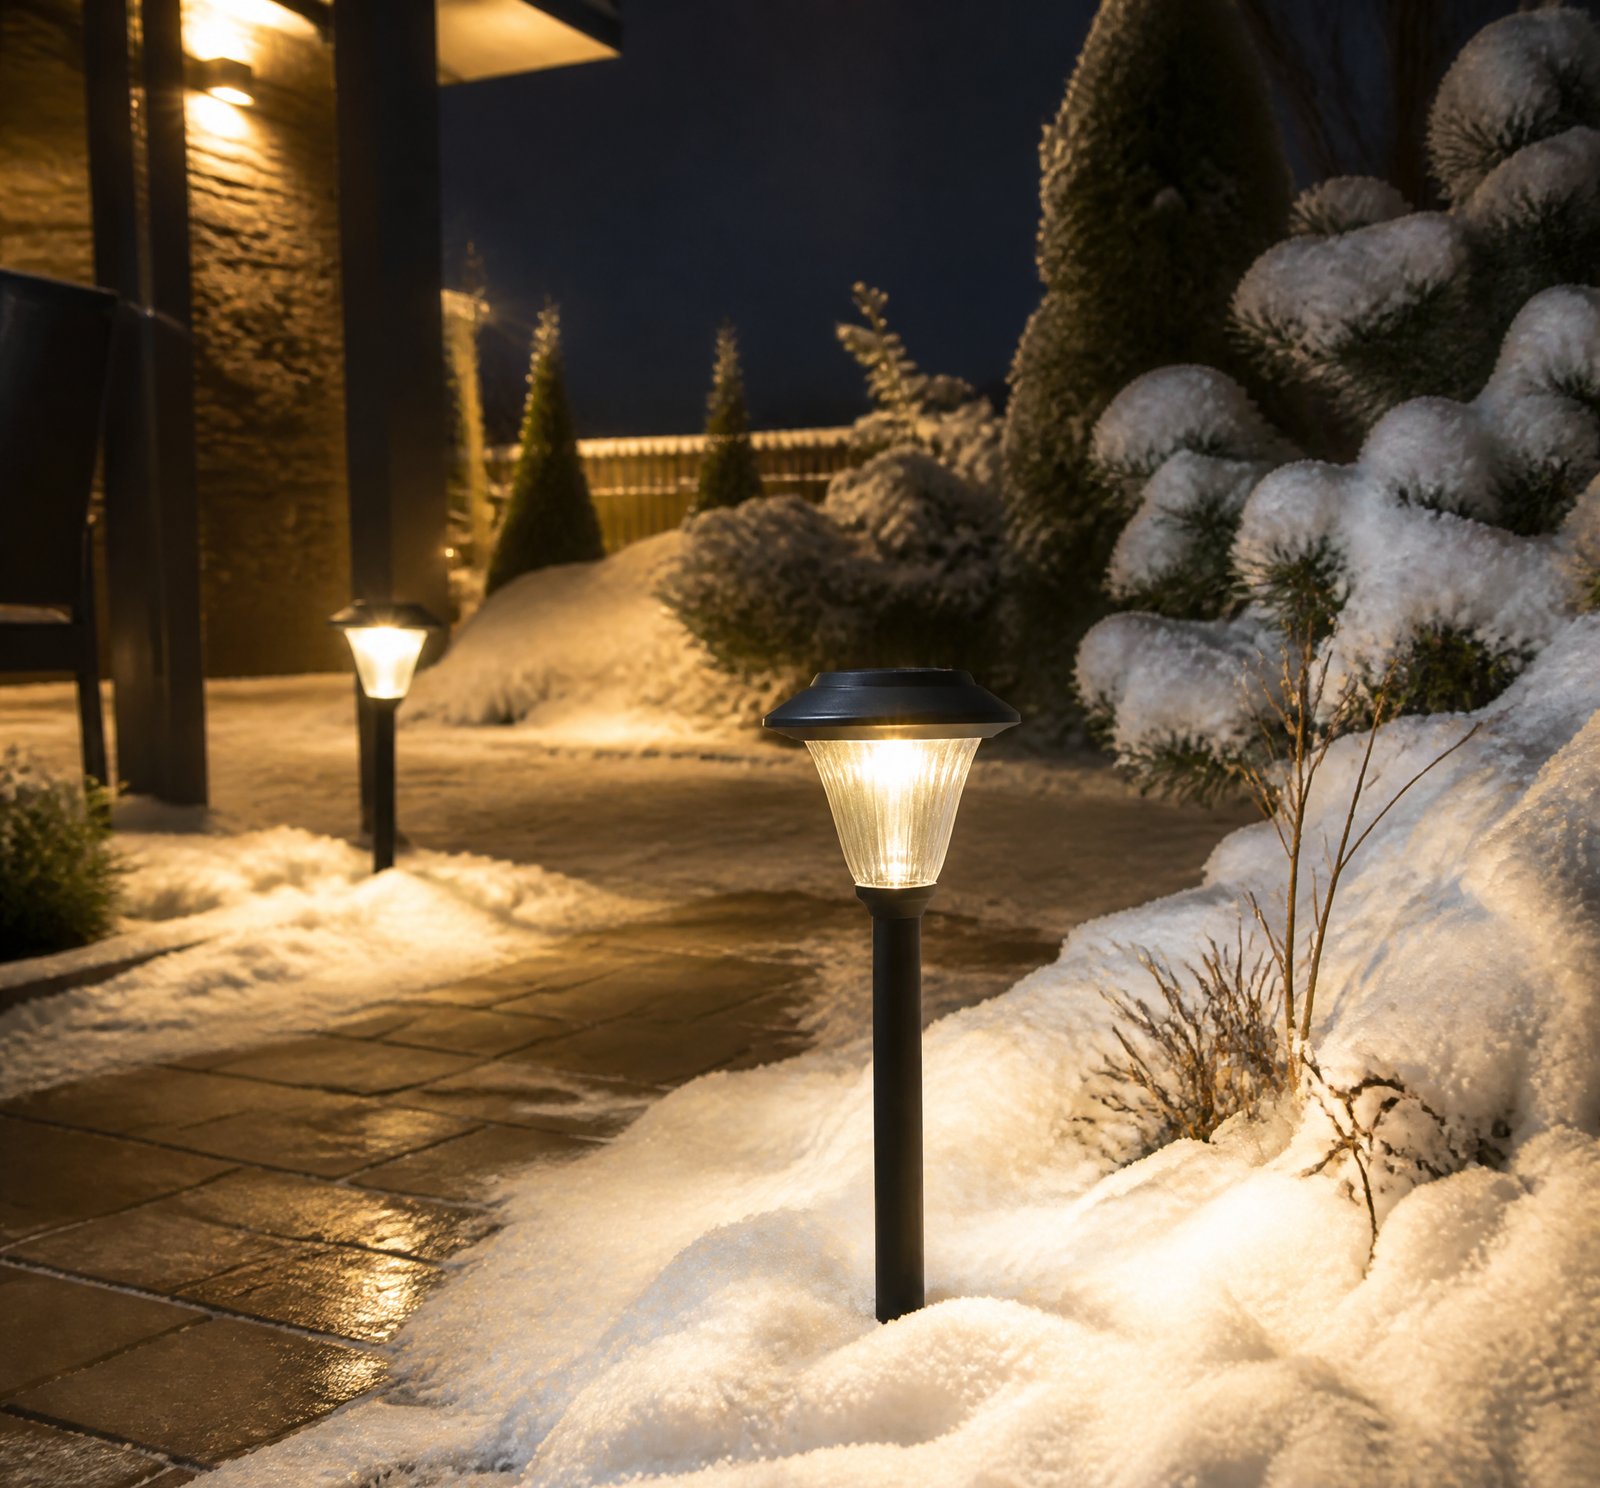
> Quick answer: Romania’s higher latitude, frequent cloud cover, and shorter winter daylight reduce solar lamp efficiency compared to Southern Europe. However, high-quality design with adaptive controls can still deliver reliable performance [17].
Romania’s unique geographic and climatic conditions present challenges for solar lamp performance. While the country faces reduced sunlight due to its higher latitude and frequent cloud cover, well-designed systems can still achieve reliable energy output.
Latitude’s Impact on Solar Performance in Romania
Romania lies at a much higher latitude than most of Southern Europe, which affects solar lamp efficacy significantly [4]. The solar elevation angle is lower, leading to less direct sunlight and more diffuse radiation. This shift impacts the spectral distribution of sunlight, reducing overall irradiance levels [12][9].
Cloud Cover and Its Effects on Solar Lamps
Cloud cover further diminishes solar performance in Romania. Even partial shading can significantly reduce efficiency by up to 30%, making days with overcast skies particularly challenging for optimal solar charging [13]. The reduced irradiance under cloud cover is roughly around 14,000 lux, which is insufficient for peak performance [12].
Winter Daylight Length and Solar Lamp Charging
Romania experiences notably short winter daylight hours, limiting the daily charging window. This seasonal variation makes it harder to maintain consistent solar performance compared to Southern Europe, where sunlight is more stable throughout the year [14]. The combination of reduced daylight and frequent cloud cover poses a significant challenge for solar lamps.
Design Innovations for High-Latitude Conditions
Despite these challenges, design innovations can help mitigate the effects of low irradiance. One patent describes a solar lamp that maintains good energy yield even under non-optimal exposure conditions [17]. This system uses the solar film as both a lampshade and generator to increase available surface area, leading to improved energy output.
Intelligent Energy Management Systems
Intelligent energy management systems can further enhance performance during winter months. Adaptive dimming modes allow solar-powered poles to meet lighting needs even through prolonged periods of sky cover [24]. By using these systems, solar lamps can remain functional despite limited sunlight availability.
Climate’s Role in Long-Term Performance
Cold temperatures can actually improve photovoltaic efficiency, as seen in high-altitude regions like the Himalayas and southern Andes [25]. Romania’s cold climate may benefit panel performance, offsetting some of the disadvantages due to lower irradiance. However, testing under real-world conditions is essential to ensure reliability [2][3].
Quality and Design of Solar Lamps
The quality and design of solar lamps are crucial for their effectiveness in challenging environments like Romania. Laboratory results often overestimate performance, so field testing is necessary to assess true usability [2]. High-quality systems can deliver reliable performance across diverse conditions, making them a better choice despite climate challenges.
Comparison Table: Performance Factors
| Factor | Impact on Performance |
|–––|––––––––|
| Latitude | Reduced irradiance |
| Cloud Cover | Decreased efficiency |
| Daylight Length | Limited charging window |
These factors highlight the need for innovative design and intelligent energy management to ensure reliable solar lamp performance in Romania.
Key Takeaways
- High latitude, cloud cover, and short daylight hours reduce solar lamp performance in Romania.
- Well-designed systems with increased surface area and adaptive controls can mitigate these challenges [17][24].
- Cold climates may improve panel efficiency, partially offsetting lower irradiance levels [25].
References
- [2] Impacts_of_PicoPV_and_Consumer_Research_-_energypedia__2ed9d7cd — authority
source passage
# Impacts of PicoPV and Consumer Research Source: Blog/Web URL: https://energypedia.info/wiki/Impacts_of_PicoPV_and_Consumer_Research Author: Date: 2018-08-01 Impacts of PicoPV and Consumer Research Overview As experience with other renewable technologies show, lack of social acceptance and incongruity with cultural values and norms are common barriers during the implementation phase. Therefore, it is important to investigate in users needs and behavior patterns. Additionally, experience shows that laboratory test have to be complemented with field tests in order to test the solar lanterns under real-life conditions. Due to the fact that many bad quality products exists, it is also important to test selected products in a field test. GIZ Energising Development has conducted various tests in different countries, such as Bangladesh, Bolivia, Ethiopia, Mozambique, Nicaragua, Peru, Senegal and Uganda. Approaches of these tests differ, results and outlook are presented within this articles. Performance of Solar Lamps More than 100 firms are offering PicoPV products in developing countries today, but most products are of very low quality, with serious implications for consumer trust in the new technology. Early lab tests have focused the awareness of governments and donors on the importance of quality control and customer information – however, field tests in sufficient countries with sufficient sample sizes are needed for a better understanding of PicoPV performance under real-lif
- [3] D-Lab_Off-Grid_Energy_Group_launches_Solar_Lighting_Product__84d6451b — authority
source passage
and programs working to increase access to solar energy products where they are most needed,” Verploegen says. “Our job was to figure out what was missing.” Verploegen was intrigued by the work coming out of MIT’s Comprehensive Initiative on Technology Evaluation (CITE). CITE has developed and piloted a methodology for evaluating products intended for the developing world focusing on the dimensions of suitability, scalability, and sustainability. Their first study of solar lanterns available in Uganda, published in early 2015, included a comparative chart of solar lanterns available in Uganda. “CITE is pioneering a rigorous methodology for evaluation,” comments Verploegen. “What D-Lab’s Off-Grid Energy wanted to bring to the table was the rapid dissemination of comparable product specifications linked to geographically organized distributor contact information around the world.” Verploegen didn’t have to start from scratch. Inspired by CITE’s Uganda Solar Lantern study, Verploegen researched the availability of solar lighting product information that was global in scale. He found Lighting Global, the World Bank Group platform, which has been providing basic information on solar lighting products that meet minimum quality standards since 2009 and continuously updates their database. In developing this resource, D-Lab’s Off-Grid Energy Group working from Lighting Global’s database (in fact, they will include only products that have passed Lighting Global’s quality assurance sta
- [4] Photobiology_ The Science of Light and Life — book
source passage
Riordan (1986) here to show how the direct component (sunlight) and the component scattered by the atmosphere (skylight) vary with the solar elevation (i.e. with the zenith angle). The same algorithm can be used also for visualizing how other factors, such as air pressure, air humidity, aerosol, ozone column and ground albedo affect daylight. We show the result only from 300 to 800 nm, but the paper by Bird & Riordan (1986) can be used to model radiation up to 4 micrometres, i.e. 4000 nm. Fig. 1 shows three spectra, representing the direct sunlight, the skylight (diffuse radiation), and their sum, the so called global radiation (the total daylight). On top of the figure the vertical scale is indicated by a short horizontal line on the vertical axis and a value of spectral irradiance in W m2 nm7!, Note that the skylight has its maximum moved towards shorter wavelengths compared to the direct sunlight. This corresponds to the fact that the sky appears blue in colour, and also to the fact that Rayleigh scattering is inversely proportional to the fourth power of the wavelength. Figure 1 is for the irradiance on a horisontal plane. We can now do the corresponding computation for the irradiance on a vertical plane in the compass direction (azimuth) toward the sun (Fig. 2). io) 300 400 500 600 700 800 Wavelength, nm S261 Se = c 4 S E i “ [ 7 Ss c z| = 190 . = . [ Noon 1 A ie y c C Daylight : oO ae? oe par aes : 5 O5 EF Sunlight 4 © poy ke —-—=- Skylight 1 iS ae rs) 3 | ol bee ® Q ep
- [9] Solar_Orientation_For_Solar_Arrays_and_Panels_Building_America__51d75ee4 — authority
source passage
layout greatly changes solar potential. In Site 1, a large amount of open space is available north of the buildings, but because of shading from the buildings, the area will be shaded for a large part of the year. In Site 2, the buildings and the parking lot were shifted to the north side of the site. This left the open space on the south side of the site, where shading from the buildings will not fall on the solar panels. By placing the buildings on a site with solar resource and shading in mind, the area available for solar panels can be greatly increased. If a building is designed with sloped roofs, it is best to orient the roof to maximize the roof area facing south (north-facing in the southern hemisphere). Placement on the south-facing section will ensure that the sunlight will strike the solar collector at a more optimal angle than it would if the collectors are placed on the east-, west-, or north-facing roof sections. The solar panels should be mounted on the south area of the roof and the mechanical equipment and vents should be located on the north area of the roof. Region The primary influence of climate on solar assessments comes from the availability of solar resources (amount of sunshine). Climate can also influence the type of solar thermal systems installed. This influence is described in Baechler et al (2007). Geographic influence on solar orientation and inclination are shown in the Description tab. Internet tools are available to help determine available s
- [12] Sunlight_-_Wikipedia__36dfb336 — wikipedia
source passage
(1972). "Direct Solar Radiation On Various Slopes From 0 To 60 Degrees North Latitude" (PDF). Pacific Northwest Forest and Range Experiment Station, Forest Service, U.S. Department of Agriculture, Portland, Oregon, USA. Archived (PDF) from the original on 2013-11-27. Retrieved 15 Jan 2014. – "Solar Intensity" (PDF). McAuliffe-Shepard Discovery Center. Archived from the original (PDF) on 2009-11-22. – "The Unveiling of Venus: Hot and Stifling". Science News. 109 (25): 388–389. 1976-06-19. doi:10.2307/3960800. JSTOR 3960800. 100 watts per square meter … 14,000 lux … corresponds to … daytime with overcast clouds – "Graph of variation of seasonal and latitudinal distribution of solar radiation". Museum.state.il.us. 2007-08-30. Archived from the original on 2012-01-12. Retrieved 2012-02-12. – "Graphics Gallery". Acrim.com. Archived from the original on 2014-05-02. Retrieved 2014-04-21. – Wang; et al. (2005). "Modeling the Sun's Magnetic Field and Irradiance since 1713". The Astrophysical Journal. 625 (1): 522–538. Bibcode:2005ApJ…625..522W. doi:10.1086/429689. – Steinhilber; et al. (2009). "Total solar irradiance since 1996: is there a long-term variation unrelated to solar surface magnetic phenomena?". Geophysical Research Letters. 36: L19704. Bibcode:2010A&A…523A..39S. doi:10.1051/0004-6361/200811446. – Vieira; et al. (2011). "Evolution of the solar irradiance during the Holocene". Astronomy & Astrophysics. 531: A6. arXiv:1103.4958. Bibcode:2011A&A…531A…6V. doi:10.
- [13] Why_do_solar_power_plants_work_inefficiently_-_pv_magazine_Global__212d1863 — authority
source passage
their power plants will produce under ideal conditions. In other words, it is practically impossible to see the figures declared by the cheap producers in reality, while EU-made power plants can achieve even higher production. Even small things can have a big impact However, the efficiency of even two identical solar power plants installed in different locations can differ significantly. Not only due to cloudiness, seasonality, direction or angle of the roof, but also for many other reasons. Our research shows that if even a small area of the solar panel is covered, for example, by falling leaves, dirt, or the shadow of a tree or bush – the overall efficiency of the power plant is significantly reduced. In some cases, even a tenth of the covered area can reduce total production by up to 30%. Therefore, periodic cleaning of solar modules, pruning of surrounding vegetation and similar maintenance play a crucial role. The infographic below shows how the power plant’s efficiency is reduced if leaves fall on one of the panels: Not all problems are noticed and solved so simply. Solar power plants are full of equipment, connectors, and other components that can fail or disconnect unexpectedly. As a result, electricity production can be reduced or even completely stopped. There are many different examples. The information we have gathered shows that a common problem with solar power plants is inventories heating up. They are usually housed in closed cabinets that protect them from ra
- [14] Solar_Photovoltaic_Power_Potential_by_Country_-_World_Bank_Group__ad2e869d — authority
source passage
Atlantic islands. High-potential countries tend to have low seasonality in solar photovoltaic output, meaning that the resource is relatively constant between different months of the year. In total, 86% of the global population lives in 150 countries where the difference between the maximum and the minimum output between different seasons is below a factor of two, and average daily output is above 3.5 kWh/kWp. Alongside solar resource, the potential for growth in the solar industry is determined by electricity needs; supportive or restrictive policies; costs and payback time; weather-related risks; stability of electricity grids; predictability of solar power supply; interconnection of grids enabling transmission and distribution; and other technical, social, and economic factors. Hence solar PV may still be economically attractive in countries with relatively low solar resource potential due to the prevalence of high electricity prices, or a high daytime peak load from industry or air conditioning. This report aims to provide findings for high-level comparisons between countries and regions on their solar energy potential and is intended to raise awareness, stimulate investment interest, and inform public debate. Many less-developed countries—in terms of the human development index, reliability of electricity supply, and access to electricity—tend to have very high practical solar photovoltaic potential, so far untapped. In Ethiopia just 0.005% of the country’s land area cou
- [17] DE102015015970A1_-_Device_system_of_a_solar_lamp_-_Google_Patents__48d32ece — patent
source passage
1. The PV used here must be exposed at an angle of about 0-30 ° to the sun and to the south to generate good power output. 2. As a result, the PV is limited to the top of a lamp and thus the area size is limited. 3. Solar lamps are usually not optimally positioned by the user to the sun, as their primary purpose is the illumination of a particular area. The PV modules are thus often in partial shade or completely absonnig. The necessary requirements according to Die in diesem Patent verwendet PV hat bei nicht optimaler Exposition einen verhältnismäßig guten Ertrag, das Problem der zufälligen Exposition einer Solarlampe wird damit gelöst. Durch die gleichzeitige Verwendung der Solarfolie als Lampenschirm und Solargenerator steht erheblich mehr Fläche zur Verfügung, was zu einem vergleichsweise deutlich hören Energieertrag führt.The PV used in this patent has a relatively good yield in non-optimal exposure, solving the problem of accidental exposure of a solar lamp. By the simultaneous use of the solar film as a lampshade and solar generator is considerably more area available, resulting in a comparatively clearly hear energy yield. Welchem technischen Problem hat sich der Anmelder gestelltWhat technical problem has the applicant faced? Eine Solarlampe soll hell und lange leuchten können. Dafür benötigt sie einen entsprechend hohen solaren Energieertrag. Die Funktion und Form einer Lampe beschränken jedoch die mögliche Größe einer integrierten PV. Durch die Wahl einer anderen P
- [24] US20120020060A1_-_Energy-efficient_solar-powered_-_Google_Patents__619c8cff — patent
source passage
energy savings, if dimming of the light is not sufficient to protect the batteries and operability of the system. – FIG. 49 is a plot of photovoltaic cell efficiency vs. time, for many types of PV cells, wherein the preferred PV material is shown to be in the range of 12-16 percent efficiency, and typically 13%. – FIG. 50 is a plot of test data from a solar-powered pole operating without any tie to the grid, wherein the light met lighting needs through many weeks of sky cover (clouds, overcast) in a safe range for the batteries. – FIGS. 51A and B are a plot (split onto two sheets) of operation of six solar-powered poles, without any tie to the grid, operating according to an embodiment of the active control system, wherein the poles successfully met lighting needs through many weeks of low sunshine days, even through January, when the light poles met said lighting needs by being dimmed according to energy-savings modes described later in this document. – Referring to the Figures, there may be seen some, but not the only, embodiments of the invention. FIGS. 1-18 portray some, but not the only, embodiments of solar-powered light poles and lights that may form a “population” of poles for arrays and networks and/or be implemented as single or multiple, non-networked lighting poles.FIGS. 19-33E schematically portray some, but not the only, embodiments of arrays of outdoor lighting and other powered devices that are preferably managed as embodiments of the invented wireless intelli
- [25] Coldest_Parts_of_Earth_Have_the_Best_Solar_PV_Potential_Study_Finds__812724cf — authority
source passage
# Coldest Parts of Earth Have the Best Solar (PV) Potential, Study Finds – CleanTechnica Source: Blog/Web URL: https://cleantechnica.com/2011/10/23/coldest-parts-of-earth-have-the-best-solar-pv-potential-study-finds/ Author: Nicholas Brown Date: 2011-10-23 Support CleanTechnica's work through a Substack subscription or on Stripe. According to a new study, some of the coldest geographic locations on earth have the best solar power generation potential if using photovoltaic panels. Some of the regions include the southern Andes and the Himalayas. The two main reasons why some of the coldest regions on earth have the best solar power generation potential are: – They are at high altitudes, which are exposed to more sunlight. – Some types of solar cells (the electricity-generating part of solar panels) generate electricity more efficiently at cold temperatures. Traditional silicon wafer solar cells are affected by heat more than others and, like all solar panels, are exposed to reasonably high temperatures all day long. I should also add that, according to a study, heat from solar radiation (sunlight) is what degrades solar cells as well as the transparent panels that they are protected behind, and more so than any other environmental factor by far. Heat is almost the exclusive destroyer of solar cells. Because solar cells do not exhibit any measurable degradation without much heat, it is reasonable to assume that they will last longer in colder climates. It is important, however,
# Impacts of PicoPV and Consumer Research Source: Blog/Web URL: https://energypedia.info/wiki/Impacts_of_PicoPV_and_Consumer_Research Author: Date: 2018-08-01 Impacts of PicoPV and Consumer Research Overview As experience with other renewable technologies show, lack of social acceptance and incongruity with cultural values and norms are common barriers during the implementation phase. Therefore, it is important to investigate in users needs and behavior patterns. Additionally, experience shows that laboratory test have to be complemented with field tests in order to test the solar lanterns under real-life conditions. Due to the fact that many bad quality products exists, it is also important to test selected products in a field test. GIZ Energising Development has conducted various tests in different countries, such as Bangladesh, Bolivia, Ethiopia, Mozambique, Nicaragua, Peru, Senegal and Uganda. Approaches of these tests differ, results and outlook are presented within this articles. Performance of Solar Lamps More than 100 firms are offering PicoPV products in developing countries today, but most products are of very low quality, with serious implications for consumer trust in the new technology. Early lab tests have focused the awareness of governments and donors on the importance of quality control and customer information – however, field tests in sufficient countries with sufficient sample sizes are needed for a better understanding of PicoPV performance under real-lif
and programs working to increase access to solar energy products where they are most needed,” Verploegen says. “Our job was to figure out what was missing.” Verploegen was intrigued by the work coming out of MIT’s Comprehensive Initiative on Technology Evaluation (CITE). CITE has developed and piloted a methodology for evaluating products intended for the developing world focusing on the dimensions of suitability, scalability, and sustainability. Their first study of solar lanterns available in Uganda, published in early 2015, included a comparative chart of solar lanterns available in Uganda. “CITE is pioneering a rigorous methodology for evaluation,” comments Verploegen. “What D-Lab’s Off-Grid Energy wanted to bring to the table was the rapid dissemination of comparable product specifications linked to geographically organized distributor contact information around the world.” Verploegen didn’t have to start from scratch. Inspired by CITE’s Uganda Solar Lantern study, Verploegen researched the availability of solar lighting product information that was global in scale. He found Lighting Global, the World Bank Group platform, which has been providing basic information on solar lighting products that meet minimum quality standards since 2009 and continuously updates their database. In developing this resource, D-Lab’s Off-Grid Energy Group working from Lighting Global’s database (in fact, they will include only products that have passed Lighting Global’s quality assurance sta
Riordan (1986) here to show how the direct component (sunlight) and the component scattered by the atmosphere (skylight) vary with the solar elevation (i.e. with the zenith angle). The same algorithm can be used also for visualizing how other factors, such as air pressure, air humidity, aerosol, ozone column and ground albedo affect daylight. We show the result only from 300 to 800 nm, but the paper by Bird & Riordan (1986) can be used to model radiation up to 4 micrometres, i.e. 4000 nm. Fig. 1 shows three spectra, representing the direct sunlight, the skylight (diffuse radiation), and their sum, the so called global radiation (the total daylight). On top of the figure the vertical scale is indicated by a short horizontal line on the vertical axis and a value of spectral irradiance in W m2 nm7!, Note that the skylight has its maximum moved towards shorter wavelengths compared to the direct sunlight. This corresponds to the fact that the sky appears blue in colour, and also to the fact that Rayleigh scattering is inversely proportional to the fourth power of the wavelength. Figure 1 is for the irradiance on a horisontal plane. We can now do the corresponding computation for the irradiance on a vertical plane in the compass direction (azimuth) toward the sun (Fig. 2). io) 300 400 500 600 700 800 Wavelength, nm S261 Se = c 4 S E i “ [ 7 Ss c z| = 190 . = . [ Noon 1 A ie y c C Daylight : oO ae? oe par aes : 5 O5 EF Sunlight 4 © poy ke —-—=- Skylight 1 iS ae rs) 3 | ol bee ® Q ep
layout greatly changes solar potential. In Site 1, a large amount of open space is available north of the buildings, but because of shading from the buildings, the area will be shaded for a large part of the year. In Site 2, the buildings and the parking lot were shifted to the north side of the site. This left the open space on the south side of the site, where shading from the buildings will not fall on the solar panels. By placing the buildings on a site with solar resource and shading in mind, the area available for solar panels can be greatly increased. If a building is designed with sloped roofs, it is best to orient the roof to maximize the roof area facing south (north-facing in the southern hemisphere). Placement on the south-facing section will ensure that the sunlight will strike the solar collector at a more optimal angle than it would if the collectors are placed on the east-, west-, or north-facing roof sections. The solar panels should be mounted on the south area of the roof and the mechanical equipment and vents should be located on the north area of the roof. Region The primary influence of climate on solar assessments comes from the availability of solar resources (amount of sunshine). Climate can also influence the type of solar thermal systems installed. This influence is described in Baechler et al (2007). Geographic influence on solar orientation and inclination are shown in the Description tab. Internet tools are available to help determine available s
(1972). "Direct Solar Radiation On Various Slopes From 0 To 60 Degrees North Latitude" (PDF). Pacific Northwest Forest and Range Experiment Station, Forest Service, U.S. Department of Agriculture, Portland, Oregon, USA. Archived (PDF) from the original on 2013-11-27. Retrieved 15 Jan 2014. – "Solar Intensity" (PDF). McAuliffe-Shepard Discovery Center. Archived from the original (PDF) on 2009-11-22. – "The Unveiling of Venus: Hot and Stifling". Science News. 109 (25): 388–389. 1976-06-19. doi:10.2307/3960800. JSTOR 3960800. 100 watts per square meter … 14,000 lux … corresponds to … daytime with overcast clouds – "Graph of variation of seasonal and latitudinal distribution of solar radiation". Museum.state.il.us. 2007-08-30. Archived from the original on 2012-01-12. Retrieved 2012-02-12. – "Graphics Gallery". Acrim.com. Archived from the original on 2014-05-02. Retrieved 2014-04-21. – Wang; et al. (2005). "Modeling the Sun's Magnetic Field and Irradiance since 1713". The Astrophysical Journal. 625 (1): 522–538. Bibcode:2005ApJ…625..522W. doi:10.1086/429689. – Steinhilber; et al. (2009). "Total solar irradiance since 1996: is there a long-term variation unrelated to solar surface magnetic phenomena?". Geophysical Research Letters. 36: L19704. Bibcode:2010A&A…523A..39S. doi:10.1051/0004-6361/200811446. – Vieira; et al. (2011). "Evolution of the solar irradiance during the Holocene". Astronomy & Astrophysics. 531: A6. arXiv:1103.4958. Bibcode:2011A&A…531A…6V. doi:10.
their power plants will produce under ideal conditions. In other words, it is practically impossible to see the figures declared by the cheap producers in reality, while EU-made power plants can achieve even higher production. Even small things can have a big impact However, the efficiency of even two identical solar power plants installed in different locations can differ significantly. Not only due to cloudiness, seasonality, direction or angle of the roof, but also for many other reasons. Our research shows that if even a small area of the solar panel is covered, for example, by falling leaves, dirt, or the shadow of a tree or bush – the overall efficiency of the power plant is significantly reduced. In some cases, even a tenth of the covered area can reduce total production by up to 30%. Therefore, periodic cleaning of solar modules, pruning of surrounding vegetation and similar maintenance play a crucial role. The infographic below shows how the power plant’s efficiency is reduced if leaves fall on one of the panels: Not all problems are noticed and solved so simply. Solar power plants are full of equipment, connectors, and other components that can fail or disconnect unexpectedly. As a result, electricity production can be reduced or even completely stopped. There are many different examples. The information we have gathered shows that a common problem with solar power plants is inventories heating up. They are usually housed in closed cabinets that protect them from ra
Atlantic islands. High-potential countries tend to have low seasonality in solar photovoltaic output, meaning that the resource is relatively constant between different months of the year. In total, 86% of the global population lives in 150 countries where the difference between the maximum and the minimum output between different seasons is below a factor of two, and average daily output is above 3.5 kWh/kWp. Alongside solar resource, the potential for growth in the solar industry is determined by electricity needs; supportive or restrictive policies; costs and payback time; weather-related risks; stability of electricity grids; predictability of solar power supply; interconnection of grids enabling transmission and distribution; and other technical, social, and economic factors. Hence solar PV may still be economically attractive in countries with relatively low solar resource potential due to the prevalence of high electricity prices, or a high daytime peak load from industry or air conditioning. This report aims to provide findings for high-level comparisons between countries and regions on their solar energy potential and is intended to raise awareness, stimulate investment interest, and inform public debate. Many less-developed countries—in terms of the human development index, reliability of electricity supply, and access to electricity—tend to have very high practical solar photovoltaic potential, so far untapped. In Ethiopia just 0.005% of the country’s land area cou
1. The PV used here must be exposed at an angle of about 0-30 ° to the sun and to the south to generate good power output. 2. As a result, the PV is limited to the top of a lamp and thus the area size is limited. 3. Solar lamps are usually not optimally positioned by the user to the sun, as their primary purpose is the illumination of a particular area. The PV modules are thus often in partial shade or completely absonnig. The necessary requirements according to Die in diesem Patent verwendet PV hat bei nicht optimaler Exposition einen verhältnismäßig guten Ertrag, das Problem der zufälligen Exposition einer Solarlampe wird damit gelöst. Durch die gleichzeitige Verwendung der Solarfolie als Lampenschirm und Solargenerator steht erheblich mehr Fläche zur Verfügung, was zu einem vergleichsweise deutlich hören Energieertrag führt.The PV used in this patent has a relatively good yield in non-optimal exposure, solving the problem of accidental exposure of a solar lamp. By the simultaneous use of the solar film as a lampshade and solar generator is considerably more area available, resulting in a comparatively clearly hear energy yield. Welchem technischen Problem hat sich der Anmelder gestelltWhat technical problem has the applicant faced? Eine Solarlampe soll hell und lange leuchten können. Dafür benötigt sie einen entsprechend hohen solaren Energieertrag. Die Funktion und Form einer Lampe beschränken jedoch die mögliche Größe einer integrierten PV. Durch die Wahl einer anderen P
energy savings, if dimming of the light is not sufficient to protect the batteries and operability of the system. – FIG. 49 is a plot of photovoltaic cell efficiency vs. time, for many types of PV cells, wherein the preferred PV material is shown to be in the range of 12-16 percent efficiency, and typically 13%. – FIG. 50 is a plot of test data from a solar-powered pole operating without any tie to the grid, wherein the light met lighting needs through many weeks of sky cover (clouds, overcast) in a safe range for the batteries. – FIGS. 51A and B are a plot (split onto two sheets) of operation of six solar-powered poles, without any tie to the grid, operating according to an embodiment of the active control system, wherein the poles successfully met lighting needs through many weeks of low sunshine days, even through January, when the light poles met said lighting needs by being dimmed according to energy-savings modes described later in this document. – Referring to the Figures, there may be seen some, but not the only, embodiments of the invention. FIGS. 1-18 portray some, but not the only, embodiments of solar-powered light poles and lights that may form a “population” of poles for arrays and networks and/or be implemented as single or multiple, non-networked lighting poles.FIGS. 19-33E schematically portray some, but not the only, embodiments of arrays of outdoor lighting and other powered devices that are preferably managed as embodiments of the invented wireless intelli
# Coldest Parts of Earth Have the Best Solar (PV) Potential, Study Finds – CleanTechnica Source: Blog/Web URL: https://cleantechnica.com/2011/10/23/coldest-parts-of-earth-have-the-best-solar-pv-potential-study-finds/ Author: Nicholas Brown Date: 2011-10-23 Support CleanTechnica's work through a Substack subscription or on Stripe. According to a new study, some of the coldest geographic locations on earth have the best solar power generation potential if using photovoltaic panels. Some of the regions include the southern Andes and the Himalayas. The two main reasons why some of the coldest regions on earth have the best solar power generation potential are: – They are at high altitudes, which are exposed to more sunlight. – Some types of solar cells (the electricity-generating part of solar panels) generate electricity more efficiently at cold temperatures. Traditional silicon wafer solar cells are affected by heat more than others and, like all solar panels, are exposed to reasonably high temperatures all day long. I should also add that, according to a study, heat from solar radiation (sunlight) is what degrades solar cells as well as the transparent panels that they are protected behind, and more so than any other environmental factor by far. Heat is almost the exclusive destroyer of solar cells. Because solar cells do not exhibit any measurable degradation without much heat, it is reasonable to assume that they will last longer in colder climates. It is important, however,