
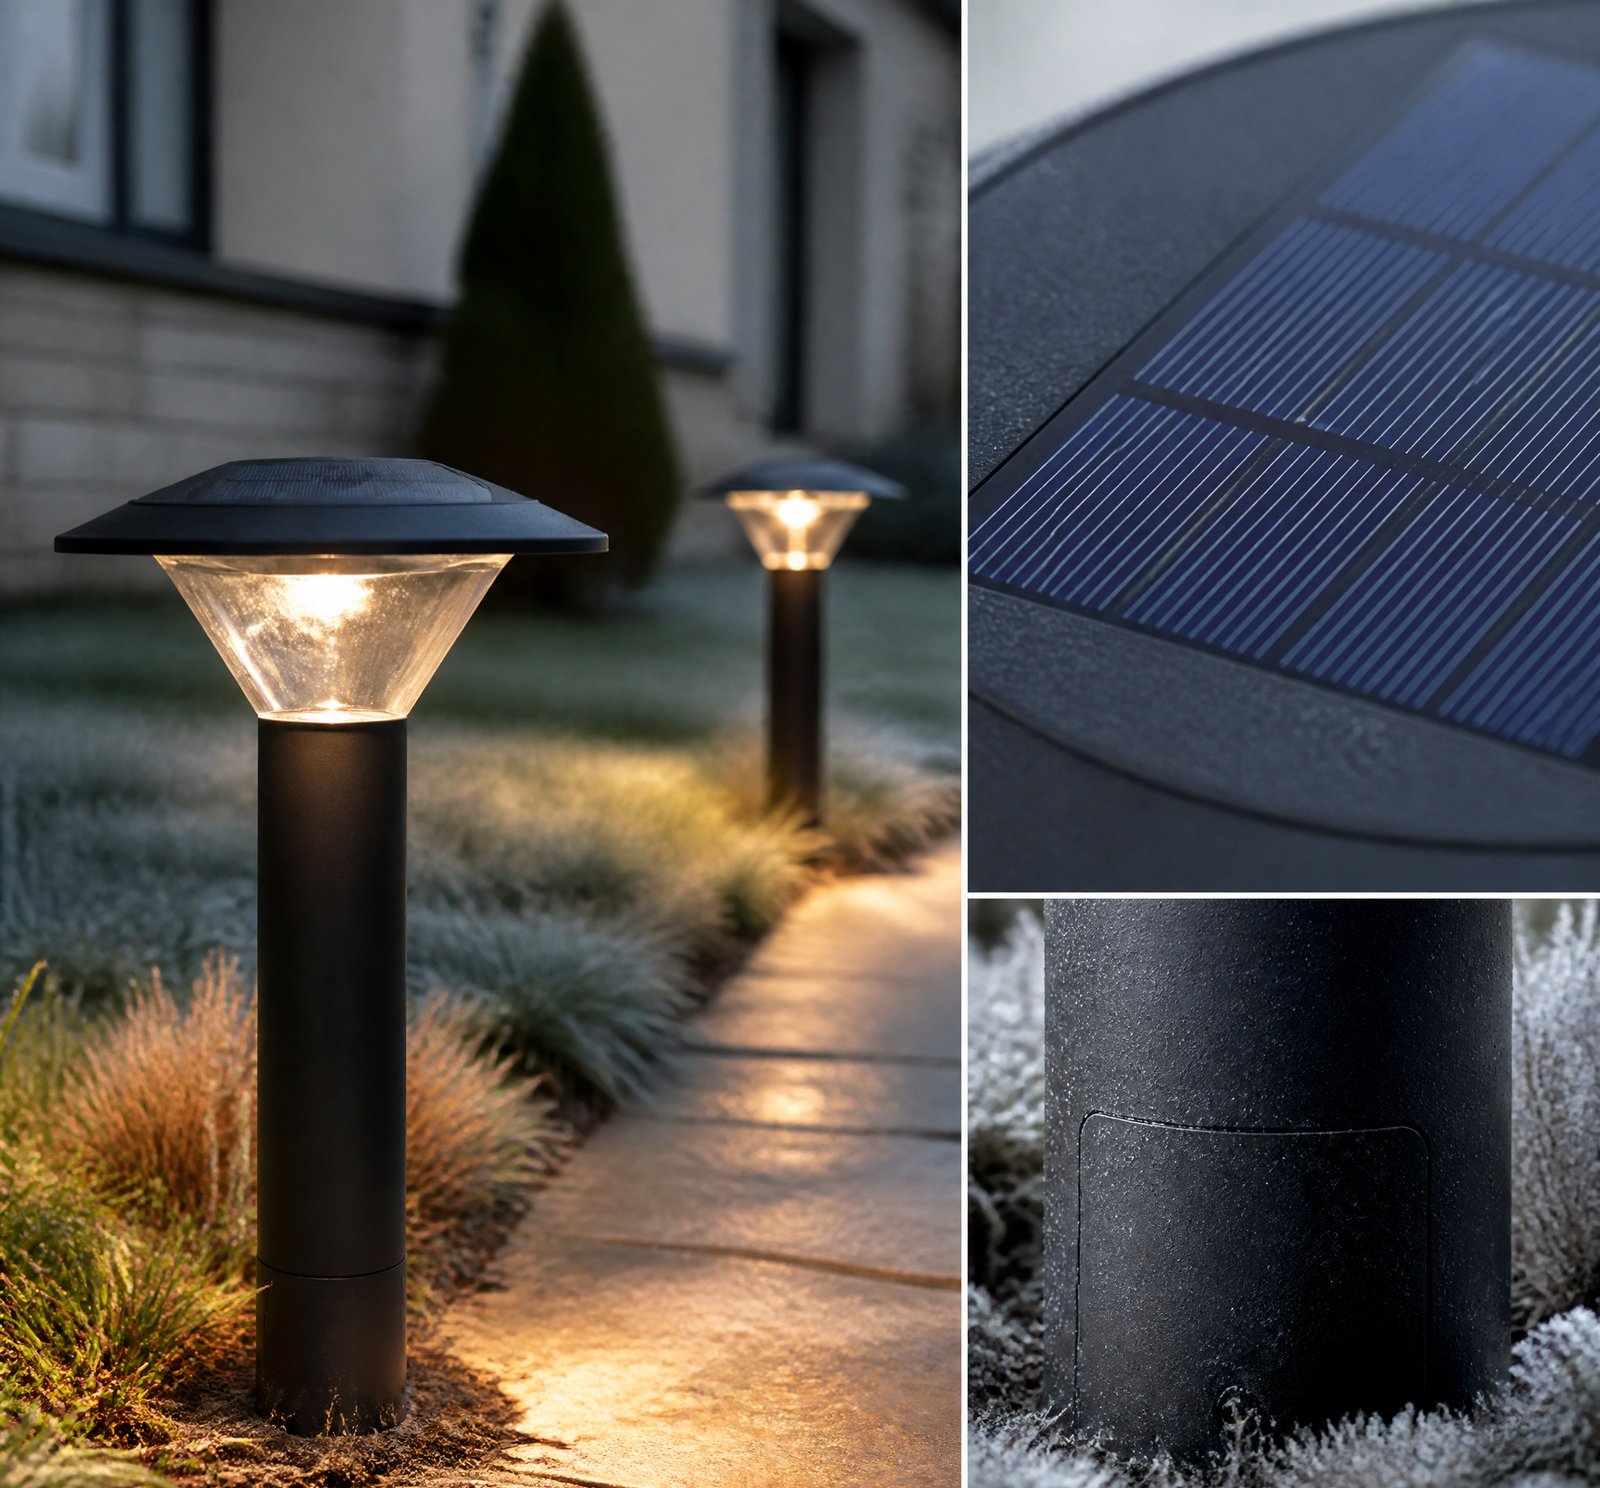
> Quick answer: As panel temperature drops from +25 °C to −10 °C, polycrystalline solar panels increase voltage output, improving impedance matching with LiFePO4 batteries. This enhances energy transfer efficiency. Maximum Power Point Tracking (MPPT) dynamically adjusts to maintain this optimal match across temperature shifts, ensuring peak performance even in cold conditions [10].
Solar lamps in Romania face unique challenges due to seasonal temperature swings—from scorching summer days to freezing winter nights. Understanding how temperature impacts the interaction between polycrystalline solar panels and LiFePO4 batteries is essential for reliable off-grid lighting. This article explains how impedance matching evolves with cooling and how MPPT compensates for performance shifts.
How Cold Temperatures Boost Solar Panel Voltage
When solar panel temperature drops from +25 °C to −10 °C, the voltage output increases significantly. This occurs because solar cells are semiconductors whose band-gap voltage rises as temperature decreases [22]. While current slightly reduces with cooler temperatures, the voltage increase dominates, improving overall power output. For example, a panel with a temperature coefficient of −0.353% per °C [18] will see its power output rise by approximately 0.353% per degree below 25 °C. Thus, at −10 °C, the panel could produce up to 3.53% more power than at standard test conditions [18].
Improved Impedance Matching in Cold Weather
Impedance matching—the alignment of a panel’s output impedance with a battery’s input impedance—determines how efficiently energy transfers. As panel voltage increases in cold temperatures, the open-circuit voltage (Voc) of polycrystalline panels rises, bringing it closer to the optimal charging voltage range of LiFePO4 batteries [22]. This shift improves the impedance matching factor, leading to more efficient energy transfer and reduced power loss during charging. This natural advantage in cold climates enhances solar lamp reliability during winter months in Romania.
Why MPPT Is Essential for Temperature Stability
Although cold improves panel voltage, real-world conditions involve fluctuating temperatures throughout the day. Without compensation, energy harvest would vary unpredictably. Maximum Power Point Tracking (MPPT) solves this by continuously adjusting the electrical load to keep the panel operating at its peak power point, regardless of temperature [10]. MPPT controllers analyze voltage and current in real time and dynamically adjust to maintain maximum output—critical during rapid temperature changes common in Romanian winters. This ensures that even when panels cool down significantly, the system remains optimized [10].
Cooling Considerations for Battery Longevity
While panels benefit from cold, LiFePO4 batteries also perform well in low temperatures compared to other lithium-ion types [8,24]. However, extreme cold can reduce their available capacity and power delivery [24]. To maintain safe operating conditions, proper housing and ventilation are crucial to prevent localized heat buildup [23]. Strategic system design—such as mounting panels away from batteries and using thermal insulation—can reduce thermal coupling and extend battery life [23]. Natural convection alone may not suffice; active cooling or thermal simulation is recommended for long-term durability [25].
| Feature | Polycrystalline Panel | LiFePO4 Battery |
|–––|––––––––|––––––|
| Optimal Temp | Lower (e.g., −10 °C) | Moderate (−20 °C to +60 °C) |
| Voltage Change with Cooling | Increases [22] | Slight drop in usable output [24] |
| Efficiency Impact of Cold | Improves [18] | Maintains stability [8] |
| Requires MPPT? | Yes for peak efficiency [10] | Yes for optimal charge control [10] |
Key Takeaways
- Cold temperatures increase polycrystalline panel voltage, improving impedance matching with LiFePO4 batteries.
- MPPT technology is essential to maintain maximum power capture across temperature swings [10].
- Proper system design—like thermal separation—prevents heat buildup and extends battery life [23].
- A panel with a −0.353% temperature coefficient gains up to 3.53% more output at −10 °C compared to 25 °C [18].
- Despite cold benefits, batteries still require thermal management to avoid capacity loss [24].
References
- [10] Battery_Power_Online_Solar_Cell_Battery_Charging_Maximizing__018eb1a0 — magazine
source passage
an Excel spreadsheet [2] is available to help you through the process. Using the design spreadsheet as a guide, we built and tested a temperature compensated MPPT circuit, again using the bq24650. The circuit is powered by a 13.6 V (VOC), 240 mA (ISC) solar cell. The MPPT circuit was tested, with and without temperature compensation, and connected to a 4.2 V, 160 mA-hr polymer Li-Ion battery. Optimizing the design for 40°C and operating the solar cell at 40°C results in a 74-minute charge time. However, when the actual operating temperature is increased to 90°C, the charge-time increases to 170 minutes, or a 130 percent increase. The same test conditions using the temperature compensating NTC circuit result in a 78-minute charge time at 40°C, and a 100-minute charge time at 90°C. Although the longer charge time at 90°C is expected because a solar panel’s power capability drops with increasing temperature, the NTC temperature compensated circuit provides a 41 percent reduction in charge time, versus not using a fixed-temperature design. Figure 4 shows charge time versus temperature for both a fixed 40°C optimized charge circuit and a NTC temperature compensated charge circuit. Because the temperature compensated design maximizes solar cell power at all temperatures, it always provides a reduction in charge time. While solar panel power utilization and charge times are always important design specifications, battery life and safety also need to be considered. Frequent over-char
- [18] How_long_do_residential_solar_panels_last_pv_magazine_International__a1e59f16 — authority
source passage
materials in their glass, encapsulation, and diffusion barriers. All panels also suffer something called light-induced degradation (LID), in which panels lose efficiency within the first hours of being exposed to the sun. LID varies from panel to panel based on the quality of the crystalline silicon wafers, but usually results in a one-time, 1-3% loss in efficiency, said testing laboratory PVEL, PV Evolution Labs. Weathering The exposure to weather conditions is the main driver in panel degradation. Heat is a key factor in both real-time panel performance and degradation over time. Ambient heat negatively affects the performance and efficiency of electrical components, according to NREL. By checking the manufacturer’s data sheet, a panel’s temperature coefficient can be found, which will demonstrate the panel’s ability to perform in higher temperatures. The coefficient explains how much real-time efficiency is lost by each degree Celsius increase above the standard temperature of 25 degrees Celsius. For example, a temperature coefficient of -0.353% means that for every degree Celsius above 25, 0.353% of total production capability is lost. Heat exchange drives panel degradation through a process called thermal cycling. When it is warm, materials expand, and when the temperature lowers, they contract. This movement slowly causes microcracks to form in the panel over time, lowering output. In its annual Module Score Card study, PVEL analyzed 36 operational solar projects in Ind
- [22] ShockleyQueisser_limit_-_Wikipedia__91c1e965 — wikipedia
source passage
voltage. For a zoc of 32.4, we find zm equal to 29.0. One can then use the formula to find the impedance matching factor. For a zoc of 32.4, this comes to 86.5%. Considering the spectrum losses alone, a solar cell has a peak theoretical efficiency of 48% (or 44% according to Shockley and Queisser – their "ultimate efficiency factor"). Thus the spectrum losses represent the vast majority of lost power. Including the effects of recombination and the I versus V curve, the efficiency is described by the following equation: with where u, v, and m are respectively the ultimate efficiency factor, the ratio of open-circuit voltage Vop to band-gap voltage Vg, and the impedance matching factor (all discussed above), and Vc is the thermal voltage, and Vs is the voltage equivalent of the temperature of the Sun. Letting ts be 1, and using the values mentioned above of 44%, 77%, and 86.5% for the three factors gives about 29% overall efficiency. Shockley and Queisser say 30% in their abstract, but do not give a detailed calculation. A more recent reference gives, for a single-junction cell, a theoretical peak performance of about 33.7%, or about 337 W/m2 in AM1.5.[1][10] When the amount of sunlight is increased using reflectors or lenses, the factor fω (and therefore f) will be higher. This raises both v and m. Shockley and Queisser include a graph showing the overall efficiency as a function of band gap for various values of f. For a value of 1, the graph shows a maximum efficiency of jus
- [23] Battery_Power_Online_Using_Thermal_Simulation_to_Design_a__df247178 — magazine
source passage
heat transfer to the battery from the top surface of the housing, PCB, and components. Optimizing the Design and Recommended Use The temperature around the battery is a critical parameter while designing such a product. Minor changes in design can significantly reduce battery temperature. For the baseline model (the original design with solar load and 2 m/s wind speed), the temperature around the battery was 54˚C. Changing the orientation and modifying the housing to separate the battery would reduce the effect of hot air inside the product to the battery. This simple design change reduces the temperature difference between the battery and the ambient by 5 percent. Other design changes could be made to allow air flow inside the housing. Such a design modification would reduce the temperature difference between the battery and ambient by 25 percent for wind speed of 2 m/s. However, this modification would involve changing the IP65 specification of the product and increases the manufacturing cost. The temperature difference between the battery and outside air would have been 200 percent less if the product was not exposed to the sun. Changing how the product is oriented would also reduce the temperature difference between the battery and ambient by 15 to 25 percent for various wind speeds. Changing how the product could be mounted on the pole would require only few design modifications and negligibly affect the product’s cost. Using thermal simulations, with its fidelity pro
- [24] NanoEnergy_Lab_Research__5082bccc — authority
source passage
scavenging [2]. Publications: Wehmeyer et al.; Chen et al.; Dames; Miller et al. Maximally utilizing the innately periodic availability of sunlight as a constant source of energy is a long-standing challenge. Inspired by the idea of the electrical diode bridge, used to convert AC signals into DC signals, we have developed a thermal analogue to address this problem. As shown in figure 1a, the thermal diode bridge harvests solar energy during the day to provide heat to the hot mass (thermal storage), and then releases heat to the night sky to provide cooling for the cold mass. This converts the time-periodic temperature input into two relatively constant temperatures, T1 and T2, across the heat engine. For a sine wave temperature input, Tmax – Tmin is the maximum possible ΔT over the heat engine, and the power output is proportional to (ΔT)2. The thermal diode bridge improves the ΔT over the heat engine and hence significantly improves the power output. As shown in figure 1b, the thermal diode bridge increases the power output of an otherwise unchanged system by a factor of four. An important application we see for thermally functional devices is the thermal management of lithium ion batteries (LIBs), which perform poorly in extreme temperatures. In cold weather, LIBs have reduced capacity and power capability. A hot day, on the other hand, will make batteries degrade faster, or even lead to thermal runaway and fire if not well thermally managed. We have developed a thermal reg
- [25] Advances in Lithium-Ion Batteries — book
source passage
at 10 It. This issue can be explained by the nonlinearity of the thermal behavior, which is not included in the battery model. FIGURE 11.17 Second validation test at 25 °C. (For color version of this figure, the reader is referred to the online version of this book.) 5.3 Evolution of the Heat Transfer Coefficient In PHEVs, the battery is subjected to low and high current rates over a wide state of charge window. Due to these heavy operating conditions, the battery temperature can reach the maximum allowed temperature. Thus, in order to keep the battery in a safe operating region, a cooling system is needed. Appropriate cooling depends on the applied heat transfer coefficient. In order to evaluate this aspect, the same test as in Figure 11.4 at room temperature (21–22 °C) has been employed. In Figure 11.18, the surface temperature of the battery is illustrated at different fan speed settings (1: slow; 2: fast). FIGURE 11.18 Evolution of the surface temperature at different cooling settings. (For color version, refer to the plate section.) During natural convection, the initial temperature of 22 °C reaches 34–35 °C. As reported in [9], the ageing phenomena in the battery accelerate at elevated temperatures and the cycle life of the cell decreases. At setting 1 and 2 of the ventilator, the temperature increase is limited to 5–6 °C. Based on these temperature evolutions and produced power losses, the heat transfer coefficient is 13.7, 44.4, and 57.1 W/m2 °C at natural convection,
an Excel spreadsheet [2] is available to help you through the process. Using the design spreadsheet as a guide, we built and tested a temperature compensated MPPT circuit, again using the bq24650. The circuit is powered by a 13.6 V (VOC), 240 mA (ISC) solar cell. The MPPT circuit was tested, with and without temperature compensation, and connected to a 4.2 V, 160 mA-hr polymer Li-Ion battery. Optimizing the design for 40°C and operating the solar cell at 40°C results in a 74-minute charge time. However, when the actual operating temperature is increased to 90°C, the charge-time increases to 170 minutes, or a 130 percent increase. The same test conditions using the temperature compensating NTC circuit result in a 78-minute charge time at 40°C, and a 100-minute charge time at 90°C. Although the longer charge time at 90°C is expected because a solar panel’s power capability drops with increasing temperature, the NTC temperature compensated circuit provides a 41 percent reduction in charge time, versus not using a fixed-temperature design. Figure 4 shows charge time versus temperature for both a fixed 40°C optimized charge circuit and a NTC temperature compensated charge circuit. Because the temperature compensated design maximizes solar cell power at all temperatures, it always provides a reduction in charge time. While solar panel power utilization and charge times are always important design specifications, battery life and safety also need to be considered. Frequent over-char
materials in their glass, encapsulation, and diffusion barriers. All panels also suffer something called light-induced degradation (LID), in which panels lose efficiency within the first hours of being exposed to the sun. LID varies from panel to panel based on the quality of the crystalline silicon wafers, but usually results in a one-time, 1-3% loss in efficiency, said testing laboratory PVEL, PV Evolution Labs. Weathering The exposure to weather conditions is the main driver in panel degradation. Heat is a key factor in both real-time panel performance and degradation over time. Ambient heat negatively affects the performance and efficiency of electrical components, according to NREL. By checking the manufacturer’s data sheet, a panel’s temperature coefficient can be found, which will demonstrate the panel’s ability to perform in higher temperatures. The coefficient explains how much real-time efficiency is lost by each degree Celsius increase above the standard temperature of 25 degrees Celsius. For example, a temperature coefficient of -0.353% means that for every degree Celsius above 25, 0.353% of total production capability is lost. Heat exchange drives panel degradation through a process called thermal cycling. When it is warm, materials expand, and when the temperature lowers, they contract. This movement slowly causes microcracks to form in the panel over time, lowering output. In its annual Module Score Card study, PVEL analyzed 36 operational solar projects in Ind
voltage. For a zoc of 32.4, we find zm equal to 29.0. One can then use the formula to find the impedance matching factor. For a zoc of 32.4, this comes to 86.5%. Considering the spectrum losses alone, a solar cell has a peak theoretical efficiency of 48% (or 44% according to Shockley and Queisser – their "ultimate efficiency factor"). Thus the spectrum losses represent the vast majority of lost power. Including the effects of recombination and the I versus V curve, the efficiency is described by the following equation: with where u, v, and m are respectively the ultimate efficiency factor, the ratio of open-circuit voltage Vop to band-gap voltage Vg, and the impedance matching factor (all discussed above), and Vc is the thermal voltage, and Vs is the voltage equivalent of the temperature of the Sun. Letting ts be 1, and using the values mentioned above of 44%, 77%, and 86.5% for the three factors gives about 29% overall efficiency. Shockley and Queisser say 30% in their abstract, but do not give a detailed calculation. A more recent reference gives, for a single-junction cell, a theoretical peak performance of about 33.7%, or about 337 W/m2 in AM1.5.[1][10] When the amount of sunlight is increased using reflectors or lenses, the factor fω (and therefore f) will be higher. This raises both v and m. Shockley and Queisser include a graph showing the overall efficiency as a function of band gap for various values of f. For a value of 1, the graph shows a maximum efficiency of jus
heat transfer to the battery from the top surface of the housing, PCB, and components. Optimizing the Design and Recommended Use The temperature around the battery is a critical parameter while designing such a product. Minor changes in design can significantly reduce battery temperature. For the baseline model (the original design with solar load and 2 m/s wind speed), the temperature around the battery was 54˚C. Changing the orientation and modifying the housing to separate the battery would reduce the effect of hot air inside the product to the battery. This simple design change reduces the temperature difference between the battery and the ambient by 5 percent. Other design changes could be made to allow air flow inside the housing. Such a design modification would reduce the temperature difference between the battery and ambient by 25 percent for wind speed of 2 m/s. However, this modification would involve changing the IP65 specification of the product and increases the manufacturing cost. The temperature difference between the battery and outside air would have been 200 percent less if the product was not exposed to the sun. Changing how the product is oriented would also reduce the temperature difference between the battery and ambient by 15 to 25 percent for various wind speeds. Changing how the product could be mounted on the pole would require only few design modifications and negligibly affect the product’s cost. Using thermal simulations, with its fidelity pro
scavenging [2]. Publications: Wehmeyer et al.; Chen et al.; Dames; Miller et al. Maximally utilizing the innately periodic availability of sunlight as a constant source of energy is a long-standing challenge. Inspired by the idea of the electrical diode bridge, used to convert AC signals into DC signals, we have developed a thermal analogue to address this problem. As shown in figure 1a, the thermal diode bridge harvests solar energy during the day to provide heat to the hot mass (thermal storage), and then releases heat to the night sky to provide cooling for the cold mass. This converts the time-periodic temperature input into two relatively constant temperatures, T1 and T2, across the heat engine. For a sine wave temperature input, Tmax – Tmin is the maximum possible ΔT over the heat engine, and the power output is proportional to (ΔT)2. The thermal diode bridge improves the ΔT over the heat engine and hence significantly improves the power output. As shown in figure 1b, the thermal diode bridge increases the power output of an otherwise unchanged system by a factor of four. An important application we see for thermally functional devices is the thermal management of lithium ion batteries (LIBs), which perform poorly in extreme temperatures. In cold weather, LIBs have reduced capacity and power capability. A hot day, on the other hand, will make batteries degrade faster, or even lead to thermal runaway and fire if not well thermally managed. We have developed a thermal reg
at 10 It. This issue can be explained by the nonlinearity of the thermal behavior, which is not included in the battery model. FIGURE 11.17 Second validation test at 25 °C. (For color version of this figure, the reader is referred to the online version of this book.) 5.3 Evolution of the Heat Transfer Coefficient In PHEVs, the battery is subjected to low and high current rates over a wide state of charge window. Due to these heavy operating conditions, the battery temperature can reach the maximum allowed temperature. Thus, in order to keep the battery in a safe operating region, a cooling system is needed. Appropriate cooling depends on the applied heat transfer coefficient. In order to evaluate this aspect, the same test as in Figure 11.4 at room temperature (21–22 °C) has been employed. In Figure 11.18, the surface temperature of the battery is illustrated at different fan speed settings (1: slow; 2: fast). FIGURE 11.18 Evolution of the surface temperature at different cooling settings. (For color version, refer to the plate section.) During natural convection, the initial temperature of 22 °C reaches 34–35 °C. As reported in [9], the ageing phenomena in the battery accelerate at elevated temperatures and the cycle life of the cell decreases. At setting 1 and 2 of the ventilator, the temperature increase is limited to 5–6 °C. Based on these temperature evolutions and produced power losses, the heat transfer coefficient is 13.7, 44.4, and 57.1 W/m2 °C at natural convection,