
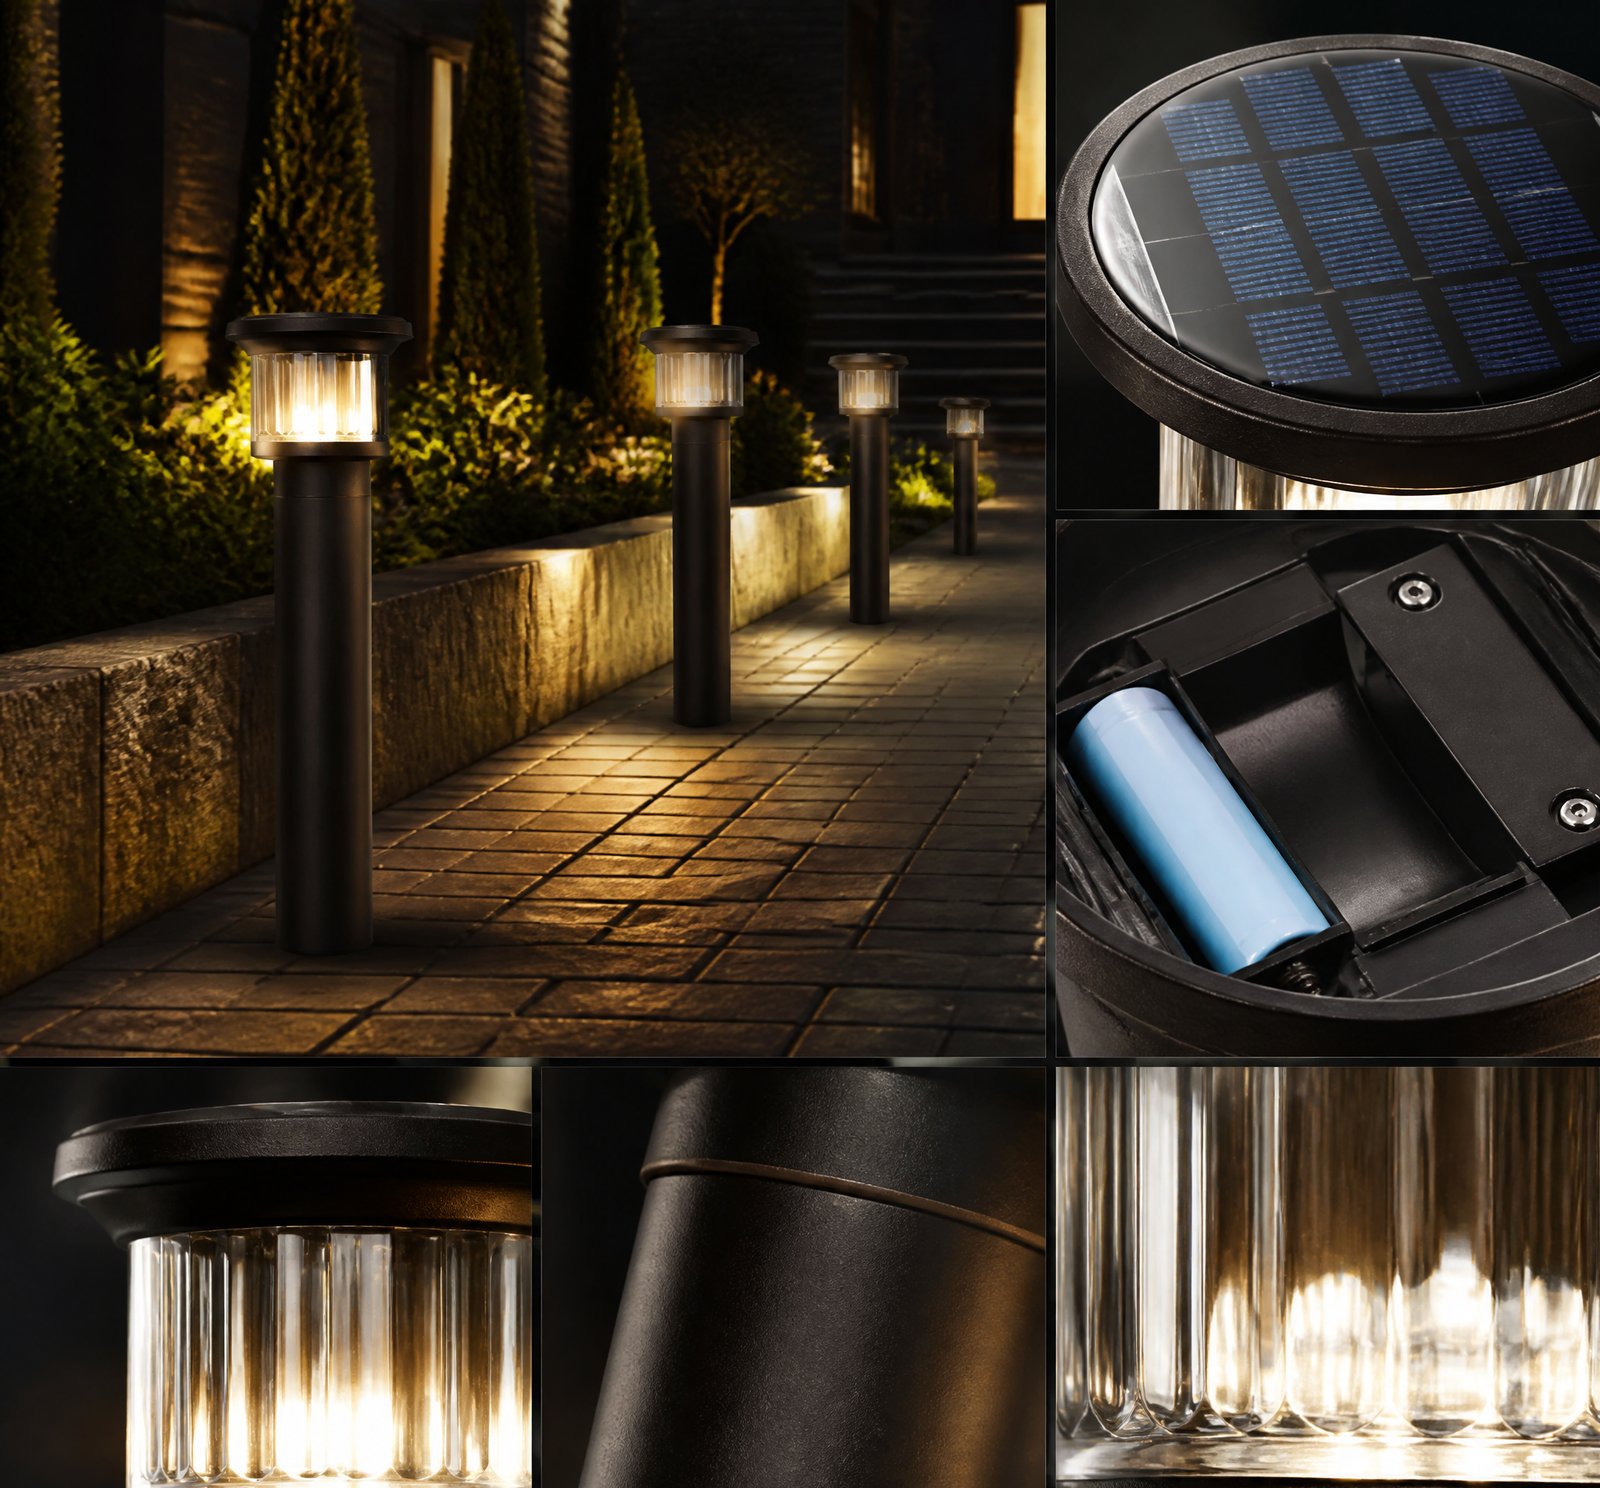
Quick answer: Temperaturile ambiante între -25 °C și +40 °C influențează semnificativ performanța lămpilor solare: bateriile pierd capacitate sub 0 °C și se deteriorează la peste 25 °C [11][15], LED-urile scad eficiența la peste 45 °C [6], iar driverii se încălzesc, reducând eficiența la temperaturi ridicate [8]. În România, aceste variații sunt reale și necesită componente adaptate.
În România, unde iernile pot scădea sub -20 °C iar vară în sudul țării ajunge la peste 40 °C, performanța lămpilor solare nu este aceeași pe tot parcursul anului. Temperatura ambiantă afectează direct bateriile, LED-urile și eficiența driverului, iar înțelegerea acestor efecte este esențială pentru a alege un sistem durabil și eficient. Ce se întâmplă cu lampa solară când e frig sau căldură extremă? Răspunsul este în compoziția și proiectarea componentelor.
Impactul temperaturii asupra bateriilor
Bateriile sunt inima sistemului solar, stocând energia produsă în zi pentru a o folosi noaptea. În condiții de temperatură scăzută, sub 0 °C, capacitatea bateriei scade semnificativ, ceea ce înseamnă că pot furniza o cantitate mai mică de energie [15]. La temperaturi sub -20 °C, performanța poate fi atât de scăzută încât sistemul nu mai funcționează corespunzător [11]. În plus, timpul necesar pentru a reîncărca bateria crește considerabil în condiții de frig [15].
Pe de altă parte, temperaturile ridicate, peste 25 °C, ca cele întâlnite în vara românească, pot duce la o creștere a ratei de autodischarge și la o uzură accelerată a bateriei [15]. Descărcarea la temperaturi mari este dezavantajată, deoarece există riscul de autoîncălzire, deteriorare internă ireversibilă sau chiar explozie din cauza expansiunii termice [11]. De aceea, bateriile trebuie menținute între -20 °C și 60 °C pentru a asigura o durată de viață maximă [11].
Performanța LED-urilor în condiții extreme
LED-urile sunt eficiente și durabile, dar și ele sunt sensibile la temperatură. Funcționează cel mai bine la temperaturi scăzute [6]. La temperaturi peste 45 °C, performanța scade din cauza creșterii temperaturii joncțiunii interne [4][5]. Aceasta duce la o scădere a fluxului luminos și la o eficiență redusă [6]. În plus, căldura accelerată degradează LED-urile, scurtând durata de viață [2][6].
Proiectarea luminiței trebuie să includă disiparea căldurii eficientă – prin radiator, ventilație sau materiale termoconductoare – pentru a preveni încălzirea excesivă. Fără un sistem adecvat de răcire, chiar și un LED de calitate poate funcționa sub standard în condiții de căldură intensă.
Eficiența driverului în funcție de temperatură
Driverul este „creierul” care controlează curentul către LED-uri. La temperaturi ridicate, peste 45 °C, eficiența driverului scade semnificativ [8]. Acest lucru se datorează faptului că driverul generează căldură în timpul funcționării, iar la temperaturi mari, capacitatea sa de disipare a căldurii este redusă [8]. Rezultatul este o creștere a temperaturii interne, care poate duce la scăderea eficienței sau chiar la defectare.
Pentru a preveni aceste probleme, driverul trebuie proiectat pentru a rezista temperaturilor extreme, cu materiale termoconductoare și spații pentru ventilare sau răcire pasivă. În sistemele de înaltă performanță, se pot folosi sisteme de răcire active, dar acestea sunt rare în lămpile solare de uz casnic.
Deratingul performanței în România
În condiții de temperatură extremă, performanța sistemului scade. La peste 40 °C, fluxul luminos al LED-urilor și eficiența driverului se reduce [2][5]. La temperaturi sub -20 °C, bateria nu poate oferi capacitatea nominală, ceea ce duce la o autonomie redusă [11]. Un cumpărător trebuie să aștepte un derating al performanței în funcție de sezon: iarna, sistemul poate fi mai slab, vara, poate fi supus stresului termic.
| Component | Optim la | Impact temperaturi scăzute (<0 °C) | Impact temperaturi ridicate (>25 °C) |
|---|---|---|---|
| Baterie | 20-25 °C | Scădere capacitate [15] | Creștere autodischarge, uzură accelerată [15] |
| LED | Joasă | Scădere flux luminos [6] | Degradare rapidă, scădere eficiență [6][4] |
| Driver | Sub 45 °C | Scădere eficiență [8] | Supraîncălzire, reducere eficiență [8] |
Concluzii cheie
Temperatura ambiantă are un impact major asupra tuturor componentelor sistemului de iluminat solar. Pentru a asigura o funcționare optimă și o durată lungă de viață în condițiile românești, sistemul trebuie proiectat pentru a rezista între -20 °C și 60 °C [11]. Alegerea unor componente cu rezistență termică, proiectare adecvată pentru răcire și încălzire pasivă este crucială. În România, un sistem solar corect ales funcționează bine în ambele extreme.
References
- [2] Solid State Lighting and Displays — book
source passage
another in our test station. LEDs are known to have lifetime degradation problems at high temperatures. Although temperature is an issue with this type of lamp, we were unable to independently control temperature for each lamp. Table 2 lists the eight LED lamps that were tested, with the total number of LEDs in each lamp. Lumens, voltage, and current were observed at 22-25 degrees C. As mentioned earlier, one of the lamps was an AC lamp and the remainder were 12 volts DC. The study was designed to determine if any of these lamps were suitable for bike path, security, or parking lot lighting applications with a photovoltaic system. Proc. SPIE Vol. 4445 51 Table 2. LED Light Descriptions Light #1 | Light#2 | Light#3 | Light#4 | Light#5 | Light#6 | Light#7 | Light #8 24 LEDs 72 LEDs 24 LEDs 36 LEDs 105 LEDs 144 LEDs 40 LEDs 54 LEDs Bike path Security Security Walk-way or Security Parking Lot Security Security TEST PLAN bike path AC light Four different voltages based upon typical photovoltaic system operating points were chosen based on the following: 14.4 V, a fully charged battery with a photovoltaic system. 12.8 V, a fully charged battery without the photovoltaic system connected. 11.4 V, a battery at low voltage disconnect. 10.8 V, a fully discharged battery. Rene The following steps were used in this test procedure (12.8 volts was used as a reference voltage). After each step, the voltage was returned to 12.8 volts for a week and data was taken to determine if there had bee
- [4] Solid State Lighting Reliability — book
source passage
10% at 25,000 h. When two degradations are considered, the LED current drops a little more, about 11% at 25,000 h. LED Junction Temperature Figure 16.6 shows the LED junction temperature as a function of operation time in each scenario. The LED junction temperature increases significantly in 25,000 h for Scenario 1. This is because when LED experiences the lumen depreciation, more heat is generated by the LED, leading to the temperature rise. However, the LED junction temperature decreases for Scenario 2 when the driver’s degradation is considered only. This is because that driver’s current degrades over time, as seen in Table 16.3 Designed scenarios Case LED Driver Scenario 1 25,000 h lifetime at the constant initial Tj (L25K) No degradation Scenario 2 No degradation 25,000 h lifetime at the constant initial TD (D25K) Scenario 3 25,000 h lifetime at the constant initial Tj (L25K) 25,000 h lifetime at the constant initial TD (D25K) 16 Reliability Prediction of Integrated LED Lamps with Electrolytic Capacitor-Less. . . 467 Fig. 16.5; thus, less power is consumed by LEDs. It is found that the two degrada- tions have competing effects on the junction temperatures of the LED in a lamp. As a result, Fig. 16.6 shows that LED’s junction temperature does not change much for 0 5000 10000 15000 20000 25000 88% 90% 92% 94% 96% 98% 100% 102% Relative LED Current (%) Time (Hours) Scenario 1 Scenario 2 Scenario 3 Fig. 16.5 The LED current of each scenario 0 5000 10000 15000 20000 25000 340
- [5] Solid State Lighting Reliability — book
source passage
16.7 shows the driver’s temperature as a function of operation time in each scenario. The driver’s temperature increases about 3.5 K in 25,000 h for Scenario 1 and decreases about 3 K in the same time period for Scenario 2. As a result, the driver’s temperature does not change much for Scenario 3. It is noted that the driver’s temperature change is not as much as the LED junction temperature change for Scenarios 1 and 2. Lumen Maintenance and Lifetime Figure 16.8 shows the lumen maintenance of each scenario. For Scenario 1, the lumen maintenance drops to 70% in about 21,500 h. This means that even the LED is preselected as 25,000 h lifetime at the initial temperature, it’s actual lifetime is 0 5000 10000 15000 20000 25000 310 315 320 325 330 Driver’s Temperature (K) Time (Hours) Scenario 1 Scenario 2 Scenario 3 Fig. 16.7 The driver’s temperature of each scenario 16 Reliability Prediction of Integrated LED Lamps with Electrolytic Capacitor-Less. . . 469 reduced to 86% due to junction temperature rise. For Scenario 2, the lumen depreciation in 25,000 h is just about 7% due to the driver’s degradation. In this case where LED assumes no degradation, the lumen depreciation occurs due to the reduction of both current and temperature. For Scenario 3, the lamp’s actual lifetime is about 19,600 h under the combined effect of degradations of both the LED light source and the driver, which is about 22% reduction of the initial lifetime. The simulation results shown above illustrate only
- [6] LED Lighting Design Practical Applications — book
source passage
infrared thermometer can be used for non-contact measurement. The optical parameters of LEDs include luminous flux, correlated color temperature, radian flux, chromaticity coordinates, color rendering index, and emission wavelength. The output optical parameters of LEDs can be measured using photometric and colorimetric parameters (PMT), spectroradiometer, and CCD spectrometer. Electrical parameters of LEDs include leakage current, forward current, forward voltage, power dissipation, and the current flow caused by generation/recombination of carriers. The temperature, optical, and electrical performances are dependent on each other. For example, the temperature of LEDs is related to the forward voltage, luminous flux, and dominant wavelength. The performance degradation phenomena for LED devices include (1) light output de- crease; (2) leakage and generation-recombination current increase; (3) increase in series resistance and temperature of the devices; and (4) modifications of spectral properties. 181 Reliability Engineering of High Power LED Packaging Table 5.1. Some environmental reliability test conditions of Cree—XLamp and Luxeon-K2 ee ee ere eee es ee ee Stress Conditions ee ee ee re ee OS SR Ie es Rg Test Method RTOL HTOL LTO WHTOL Thermal Shock Mechanical Shock Salt Atmosphere Cree—XLamp Ambient Temperature: 45 °C Forward Current: Maximum in datasheet Test Period: 1008 hours Ambient Temperature: 85 °C Forward Current: Maximum in datasheet Test Period: 1008 hours Ambi
- [8] Battery Power Online Using Thermal Simulation to Design a — magazine
source passage
we used the ambient temperature of 45˚C. Previous simulations proved that the wind impinging on the front of the housing and sun exposure on the top of the housing would lead to maximum temperature for the components. During the steady state, the heat would be balanced between internal heat generation, heat transfer caused by solar flux, and heat transfer from the housing to ambient. Conduction would occur between bodies that are in direct contact, and this is not shown in the heat transfer path (Figure 1). The battery does not dissipate power, and it is heated up by conduction through the surface area in contact with the mounting plate, through convection from the internal air, and through radiation from the adjacent surfaces. The Tests and Analysis Results For analyzing the critical state of the product, the temperature of individual components was compared with its temperature limit. Because the battery contains chemicals, its ambient air temperature must be below a specified temperature limit. The temperature in and around battery will vary throughout its lifetime. We performed simulation for various wind speeds and designs with constant internal heat generation and solar flux. The base measurement with which to compare our simulations were done in a lab for no solar load and 2 m/s air flow around the product. Measured temperature of the components on the PCB were in the range of ± 5 percent as predicted from our simulation for the similar conditions. Our first simulati
- [11] US20200217518A1 – Energy Storage Systems – Google Patents — patent
source passage
depend on different chemistries. Each one has a comfortable range in which it operates well, often around room temperature. For example: – With rising temperature, NiMH (Nickel Metal Hydride) lifetime (in cycles) degrades rapidly: Compared to operation around 20° C., operation at 30° C. reduces cycle life by 20%; 40° C. by 40%; 45° C. by 50%. – Lithium Ion can typically operate between −20° C. and 60° C., however as the temperature drops the discharge rate that can be supported drops dramatically. – Discharge of Lithium Ion at the high end of the temperature range is strongly advised against as self-heating can initiate which can cause a reduction in performance of the batteries; irreversible internal damage; and in some cases catastrophic failure (due to fire or thermal expansion bursting open the cells). – Most batteries need to be above 0° C. to charge. – Solid electrolyte Lithium Polymer batteries need to be between 60° C. and 100° C. to operate. – The surrounding environment can make it hard to maintain batteries within these limits, for example: – A car battery can be exposed to very low temperatures in cold climates. Battery heaters are often employed to counteract this. – Equally in hot climates electric vehicles must usually be furnished with battery cooling by heat pumps to keep them in operating range. – Batteries used in close proximity to electronics, e.g. laptop batteries, can be subjected to high temperature waste heat from the electronics. – Operation of the b
- [15] Battery capacity vs operating temperature Sizing a storage system — magazine
source passage
# Battery capacity vs. operating temperature: Sizing a storage system when ambient temperatures vary Source: Blog/Web URL: https://solarbuildermag.com/featured/sizing-battery-storage-system-when-ambient-temperatures-vary/ Author: Contributing Author Date: 2021-01-04 One of the most common questions asked by PV Installers, as well as customers, is how to properly size and charge a battery bank in places where ambient temperatures may vary considerably throughout the year. Temperature affects battery performance in two ways. The standard capacity rating of a battery is based on each cell having an electrolyte temperature of 25ºC (77ºF). Temperatures below the nominal 25ºC (77ºF) reduce the battery’s effective capacity and lengthen the time to restore the battery to full charge. Temperatures above 25ºC (77ºF) will slightly increase capacity but also will increase self-discharge and shorten battery life. Although the capacity of a battery will increase as temperatures rise, any cycle life loss due to operating at higher temperatures is not recoverable. Lower Operating Temperatures: Reduce capacity and maintain longer cycle life. Higher Operating Temperatures: Maintain capacity, increase the rate of self-discharge and battery wear and shortening battery cycle life. As ambient temperatures fall below 25ºC (77ºF), the required battery capacity to supply equivalent storage and power will increase. A multiplier is used to calculate the required battery bank capacity in cold temperatur
another in our test station. LEDs are known to have lifetime degradation problems at high temperatures. Although temperature is an issue with this type of lamp, we were unable to independently control temperature for each lamp. Table 2 lists the eight LED lamps that were tested, with the total number of LEDs in each lamp. Lumens, voltage, and current were observed at 22-25 degrees C. As mentioned earlier, one of the lamps was an AC lamp and the remainder were 12 volts DC. The study was designed to determine if any of these lamps were suitable for bike path, security, or parking lot lighting applications with a photovoltaic system. Proc. SPIE Vol. 4445 51 Table 2. LED Light Descriptions Light #1 | Light#2 | Light#3 | Light#4 | Light#5 | Light#6 | Light#7 | Light #8 24 LEDs 72 LEDs 24 LEDs 36 LEDs 105 LEDs 144 LEDs 40 LEDs 54 LEDs Bike path Security Security Walk-way or Security Parking Lot Security Security TEST PLAN bike path AC light Four different voltages based upon typical photovoltaic system operating points were chosen based on the following: 14.4 V, a fully charged battery with a photovoltaic system. 12.8 V, a fully charged battery without the photovoltaic system connected. 11.4 V, a battery at low voltage disconnect. 10.8 V, a fully discharged battery. Rene The following steps were used in this test procedure (12.8 volts was used as a reference voltage). After each step, the voltage was returned to 12.8 volts for a week and data was taken to determine if there had bee
10% at 25,000 h. When two degradations are considered, the LED current drops a little more, about 11% at 25,000 h. LED Junction Temperature Figure 16.6 shows the LED junction temperature as a function of operation time in each scenario. The LED junction temperature increases significantly in 25,000 h for Scenario 1. This is because when LED experiences the lumen depreciation, more heat is generated by the LED, leading to the temperature rise. However, the LED junction temperature decreases for Scenario 2 when the driver’s degradation is considered only. This is because that driver’s current degrades over time, as seen in Table 16.3 Designed scenarios Case LED Driver Scenario 1 25,000 h lifetime at the constant initial Tj (L25K) No degradation Scenario 2 No degradation 25,000 h lifetime at the constant initial TD (D25K) Scenario 3 25,000 h lifetime at the constant initial Tj (L25K) 25,000 h lifetime at the constant initial TD (D25K) 16 Reliability Prediction of Integrated LED Lamps with Electrolytic Capacitor-Less. . . 467 Fig. 16.5; thus, less power is consumed by LEDs. It is found that the two degrada- tions have competing effects on the junction temperatures of the LED in a lamp. As a result, Fig. 16.6 shows that LED’s junction temperature does not change much for 0 5000 10000 15000 20000 25000 88% 90% 92% 94% 96% 98% 100% 102% Relative LED Current (%) Time (Hours) Scenario 1 Scenario 2 Scenario 3 Fig. 16.5 The LED current of each scenario 0 5000 10000 15000 20000 25000 340
16.7 shows the driver’s temperature as a function of operation time in each scenario. The driver’s temperature increases about 3.5 K in 25,000 h for Scenario 1 and decreases about 3 K in the same time period for Scenario 2. As a result, the driver’s temperature does not change much for Scenario 3. It is noted that the driver’s temperature change is not as much as the LED junction temperature change for Scenarios 1 and 2. Lumen Maintenance and Lifetime Figure 16.8 shows the lumen maintenance of each scenario. For Scenario 1, the lumen maintenance drops to 70% in about 21,500 h. This means that even the LED is preselected as 25,000 h lifetime at the initial temperature, it’s actual lifetime is 0 5000 10000 15000 20000 25000 310 315 320 325 330 Driver’s Temperature (K) Time (Hours) Scenario 1 Scenario 2 Scenario 3 Fig. 16.7 The driver’s temperature of each scenario 16 Reliability Prediction of Integrated LED Lamps with Electrolytic Capacitor-Less. . . 469 reduced to 86% due to junction temperature rise. For Scenario 2, the lumen depreciation in 25,000 h is just about 7% due to the driver’s degradation. In this case where LED assumes no degradation, the lumen depreciation occurs due to the reduction of both current and temperature. For Scenario 3, the lamp’s actual lifetime is about 19,600 h under the combined effect of degradations of both the LED light source and the driver, which is about 22% reduction of the initial lifetime. The simulation results shown above illustrate only
infrared thermometer can be used for non-contact measurement. The optical parameters of LEDs include luminous flux, correlated color temperature, radian flux, chromaticity coordinates, color rendering index, and emission wavelength. The output optical parameters of LEDs can be measured using photometric and colorimetric parameters (PMT), spectroradiometer, and CCD spectrometer. Electrical parameters of LEDs include leakage current, forward current, forward voltage, power dissipation, and the current flow caused by generation/recombination of carriers. The temperature, optical, and electrical performances are dependent on each other. For example, the temperature of LEDs is related to the forward voltage, luminous flux, and dominant wavelength. The performance degradation phenomena for LED devices include (1) light output de- crease; (2) leakage and generation-recombination current increase; (3) increase in series resistance and temperature of the devices; and (4) modifications of spectral properties. 181 Reliability Engineering of High Power LED Packaging Table 5.1. Some environmental reliability test conditions of Cree—XLamp and Luxeon-K2 ee ee ere eee es ee ee Stress Conditions ee ee ee re ee OS SR Ie es Rg Test Method RTOL HTOL LTO WHTOL Thermal Shock Mechanical Shock Salt Atmosphere Cree—XLamp Ambient Temperature: 45 °C Forward Current: Maximum in datasheet Test Period: 1008 hours Ambient Temperature: 85 °C Forward Current: Maximum in datasheet Test Period: 1008 hours Ambi
we used the ambient temperature of 45˚C. Previous simulations proved that the wind impinging on the front of the housing and sun exposure on the top of the housing would lead to maximum temperature for the components. During the steady state, the heat would be balanced between internal heat generation, heat transfer caused by solar flux, and heat transfer from the housing to ambient. Conduction would occur between bodies that are in direct contact, and this is not shown in the heat transfer path (Figure 1). The battery does not dissipate power, and it is heated up by conduction through the surface area in contact with the mounting plate, through convection from the internal air, and through radiation from the adjacent surfaces. The Tests and Analysis Results For analyzing the critical state of the product, the temperature of individual components was compared with its temperature limit. Because the battery contains chemicals, its ambient air temperature must be below a specified temperature limit. The temperature in and around battery will vary throughout its lifetime. We performed simulation for various wind speeds and designs with constant internal heat generation and solar flux. The base measurement with which to compare our simulations were done in a lab for no solar load and 2 m/s air flow around the product. Measured temperature of the components on the PCB were in the range of ± 5 percent as predicted from our simulation for the similar conditions. Our first simulati
depend on different chemistries. Each one has a comfortable range in which it operates well, often around room temperature. For example: – With rising temperature, NiMH (Nickel Metal Hydride) lifetime (in cycles) degrades rapidly: Compared to operation around 20° C., operation at 30° C. reduces cycle life by 20%; 40° C. by 40%; 45° C. by 50%. – Lithium Ion can typically operate between −20° C. and 60° C., however as the temperature drops the discharge rate that can be supported drops dramatically. – Discharge of Lithium Ion at the high end of the temperature range is strongly advised against as self-heating can initiate which can cause a reduction in performance of the batteries; irreversible internal damage; and in some cases catastrophic failure (due to fire or thermal expansion bursting open the cells). – Most batteries need to be above 0° C. to charge. – Solid electrolyte Lithium Polymer batteries need to be between 60° C. and 100° C. to operate. – The surrounding environment can make it hard to maintain batteries within these limits, for example: – A car battery can be exposed to very low temperatures in cold climates. Battery heaters are often employed to counteract this. – Equally in hot climates electric vehicles must usually be furnished with battery cooling by heat pumps to keep them in operating range. – Batteries used in close proximity to electronics, e.g. laptop batteries, can be subjected to high temperature waste heat from the electronics. – Operation of the b
# Battery capacity vs. operating temperature: Sizing a storage system when ambient temperatures vary Source: Blog/Web URL: https://solarbuildermag.com/featured/sizing-battery-storage-system-when-ambient-temperatures-vary/ Author: Contributing Author Date: 2021-01-04 One of the most common questions asked by PV Installers, as well as customers, is how to properly size and charge a battery bank in places where ambient temperatures may vary considerably throughout the year. Temperature affects battery performance in two ways. The standard capacity rating of a battery is based on each cell having an electrolyte temperature of 25ºC (77ºF). Temperatures below the nominal 25ºC (77ºF) reduce the battery’s effective capacity and lengthen the time to restore the battery to full charge. Temperatures above 25ºC (77ºF) will slightly increase capacity but also will increase self-discharge and shorten battery life. Although the capacity of a battery will increase as temperatures rise, any cycle life loss due to operating at higher temperatures is not recoverable. Lower Operating Temperatures: Reduce capacity and maintain longer cycle life. Higher Operating Temperatures: Maintain capacity, increase the rate of self-discharge and battery wear and shortening battery cycle life. As ambient temperatures fall below 25ºC (77ºF), the required battery capacity to supply equivalent storage and power will increase. A multiplier is used to calculate the required battery bank capacity in cold temperatur