
> Quick answer: At −25 °C, LiFePO₄ cells experience reduced capacity due to slowed lithium-ion diffusion and increased internal resistance [4][6]. Thermal insulation can help maintain a higher internal temperature by reducing heat loss, improving operational stability.
Understanding the electrochemical processes inside LiFePO₄ cells at −25 °C is crucial for maximizing their performance in solar lamps. This article delves into how low temperatures affect these batteries and explores the benefits of thermal insulation in maintaining optimal operating conditions.
Electrochemical Challenges at Low Temperatures
At −25 °C, LiFePO₄ cells experience reduced capacity primarily due to slowed lithium-ion diffusion and increased internal resistance [4][6]. These factors hinder electrochemical kinetics, leading to diminished charge acceptance and overall performance. The low-temperature operation exacerbates the risk of lithium plating—a phenomenon where lithium ions deposit as metallic lithium on the anode surface instead of intercalating [5].
Lithium plating occurs under conditions of low temperature, overcharging, and high charging rates [5]. At −25 °C, ion mobility is particularly reduced, increasing the likelihood of non-uniform deposition and dendrite formation [5]. This can lead to internal short circuits and thermal runaway [5][16].
The electronic conductivity of LiFePO₄ at room temperature already necessitates carbon coating for performance [3], but sub-zero temperatures further impede ionic and electronic transport, amplifying these challenges. The absence or poor quality of carbon coating exacerbates the issue.
Benefits of Thermal Insulation
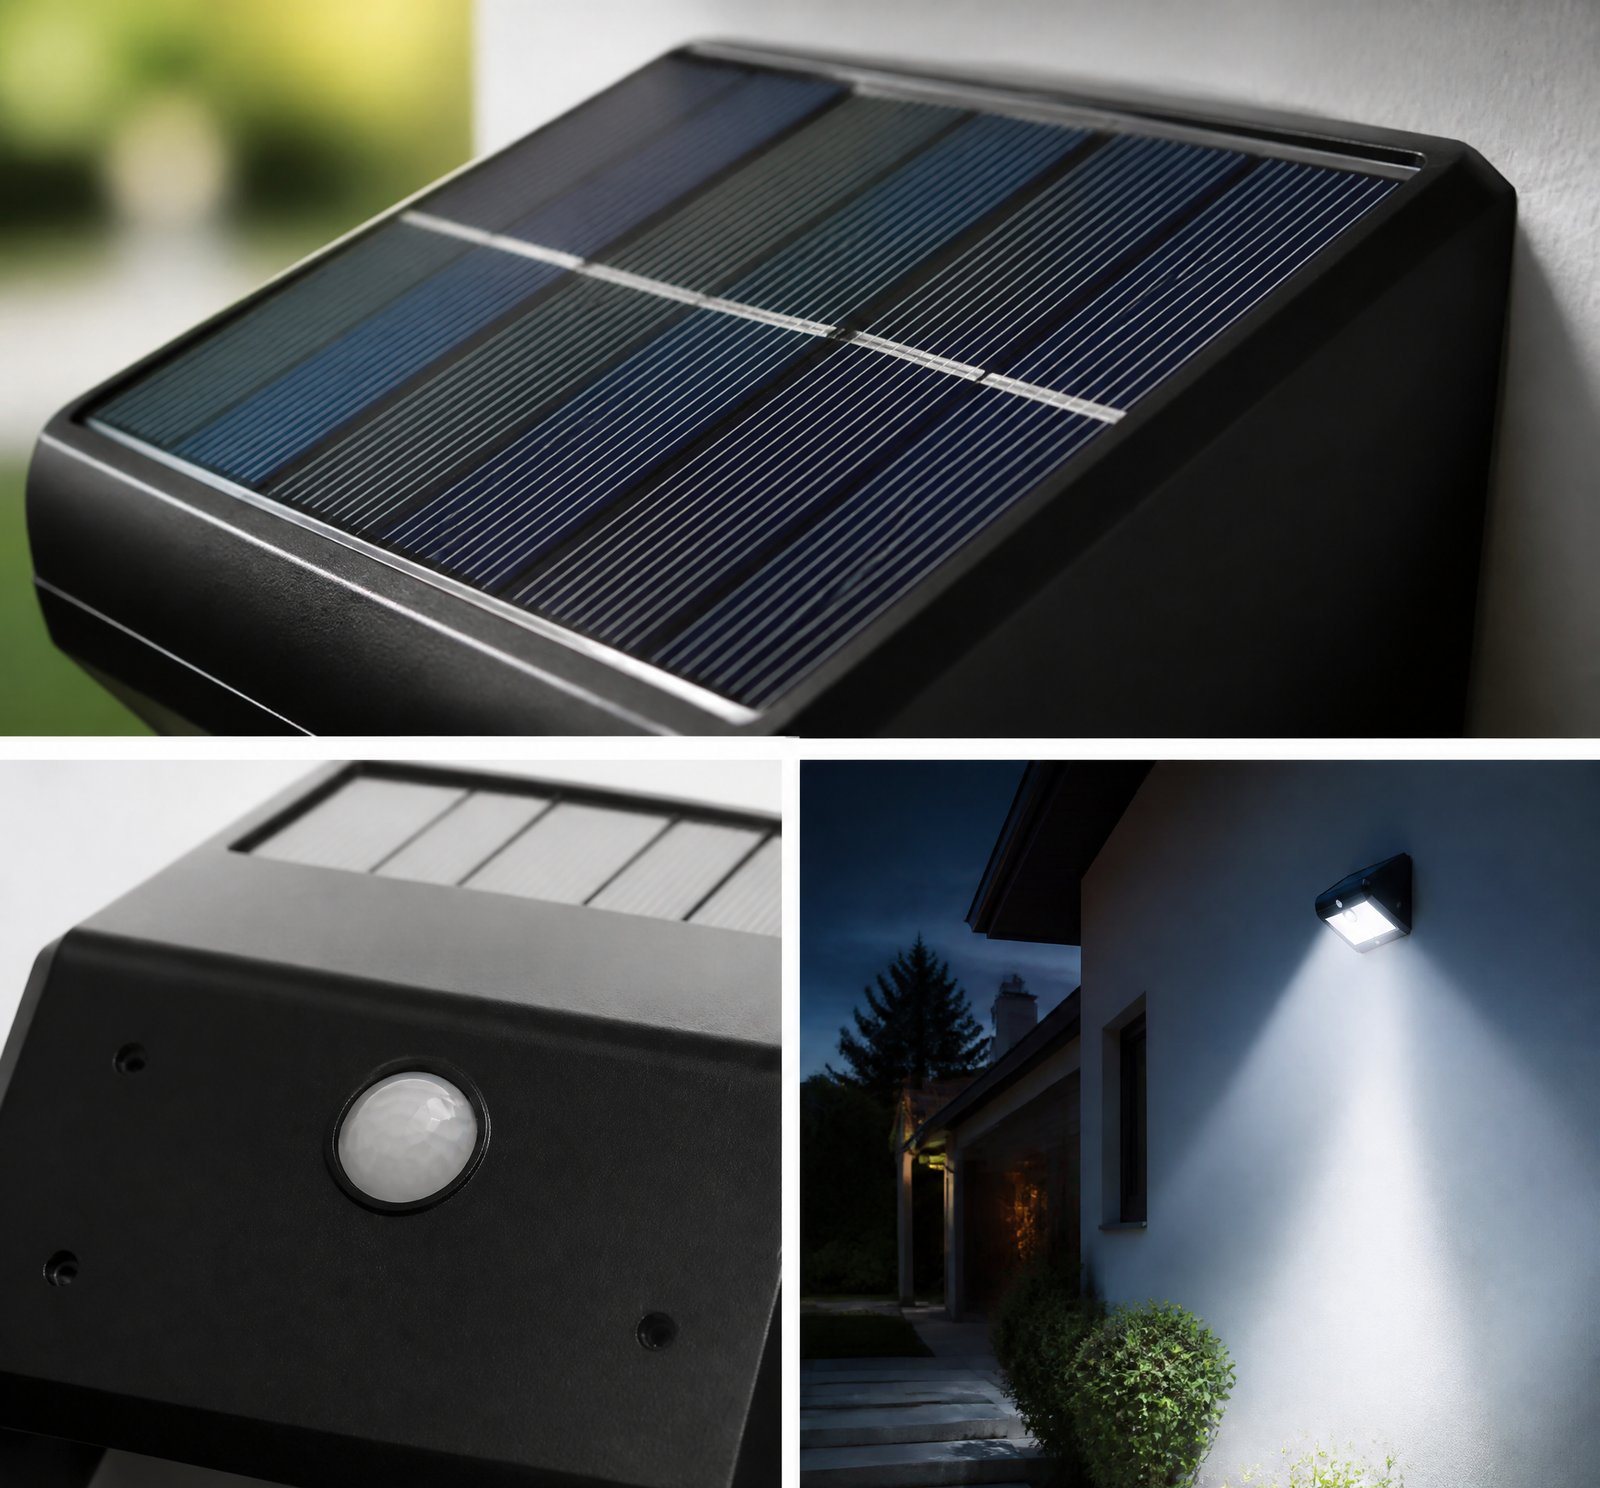
Thermal insulation alters the internal temperature profile by reducing heat loss to the environment, thereby maintaining a higher internal temperature during charge and discharge [6]. This is particularly beneficial in solar lamps where the battery is often placed near the solar panel to benefit from solar-generated heat during cold conditions [6].
The patent describes a design where the battery is positioned near the solar array so that heat absorbed during daylight helps elevate the battery’s temperature to its normal operating range, even when ambient temperatures are low [6]. This thermal proximity or insulation can mitigate performance loss by reducing thermal gradients and maintaining the cell within a more favorable thermal window.
Temperature Profiles with Insulation
While one study reports that at room temperature, discharge at 50C does not exceed 40 °C, and charging to 2.1 V leads to local temperatures up to 48 °C [9], these data do not reflect cold-weather operation. The sources do not provide direct measurements of internal temperature profiles under insulation during charge or discharge at −25 °C.
The balance between heat retention and dissipation is crucial for preventing overheating in warm environments while maintaining operability in cold conditions [24]. However, the precise impact of insulation on internal temperature gradients within the cell remains unquantified in the provided sources. The model parameter extraction study tested at 0 °C and 10 °C but not at −25 °C [17], indicating a gap in direct data.
Thermal Management and Uniformity
Thermal management is not merely about cooling but also about maintaining stable operating temperatures, especially in cold environments. Insulation or thermal coupling can help maintain operability by reducing heat loss [6]. However, the absence of specific data on internal temperature gradients under insulation at −25 °C means that the impact on uniformity and degradation remains unclear.
Non-uniform temperatures can lead to accelerated degradation and uneven cycling [5], but no data are provided on how insulation alters these gradients during cold operation. The discussion of heat flow and thermal infrared imaging suggests that temperature gradients exist, but their precise alteration with insulation is unspecified [7][9].
Comparative Stability of LiFePO₄
LiFePO₄ cells exhibit superior stability compared to other lithium-ion chemistries, particularly in terms of calendar aging and resistance to high charge states [5][10]. This makes them suitable for solar lamp applications where the battery may remain at a high SOC for extended periods. However, the sources do not specify whether this stability extends to cold-temperature operation or how insulation affects it.
Comparison Table
| Feature | Low-Temperature Operation | Thermal Insulation |
|–––|–––––––––|–––––––|
| Capacity Impact | Reduced due to slowed diffusion [4][6] | Improved by reducing heat loss [6] |
| Safety Risk | Increased risk of lithium plating and dendrites [5] | Potentially mitigated by maintaining higher internal temperatures |
Key Takeaways
- At −25 °C, LiFePO₄ cells suffer from reduced capacity due to slowed diffusion and increased resistance.
- Thermal insulation helps maintain higher internal temperatures, improving operational stability.
- Current data lack specific measurements of internal temperature profiles under insulation at −25 °C.
References
- [3] Lithium batteries and cathode materials — book
source passage
by modifying the synthesis conditions, for example, by adding a reducing agent such as ascorbic acid328 to prevent surface ferric films; the hydrothermal method can also produce material with excellent electrochemical behavior even without a carbon coating,329 as is necessary in most instances as discussed below. As this material has a very low conductivity at room temperature, it could achieve the theoretical capacity only at a very low current density315 or at elevated temperatures,317 as suggested by Padhi309 due to the low lithium diffusion at the interface. Ravet et al.318 showed that a carbon coating signifi- cantly improves the electrochemical performance of this material; sucrose was proposed319 as one carbon precursor, and it was used on the initial hydrother- mal samples.50 Many other studies have been made on finding means to improve the electronic conduc- tivity of the LiFePO4 particles.49,198,320,321,323-326 Very pure LiFePO4 samples are reported to have an electronic conductivity of 10-9 S/cm,324 whereas samples made from reagent-grade carbon-containing materials have a conductivity of around 10-5-10-6 S/cm.198 Huang et al.320 proposed coating the material with carbon-gel during the synthesis step and found capacities approaching 100% at very low cathode loadings, 5 mg/cm2, and rather high carbon contents, 20%. They obtained 800 cycles at around 120 mAh/g at high rates. Masquelier proposed321 extensive mill- ing of the material with carbon and then found high ca
- [4] A_Beginners_Guide_To_Lithium_Rechargeable_BatteriesLithium-Ion_Batteri__262fa22a — authority
source passage
batteries. Lithium-Iron-Phosphate, or LiFePO4 batteries are an altered lithium-ion chemistry, which offers the benefits of withstanding more charge/discharge cycles, while losing some energy density in the tradeoff. They operate ideally between 3.0V-3.65V, instead of the more typical 3.0-4.2V range of a standard lithium-ion chemistry. This, combined with a very flat discharge voltage curve, makes them ideal replacements for 12V lead-acid batteries in many applications, where four cells substitute for the original six. They’re generally more stable, with lower rates of self-discharge and capacity loss over time. Respect The Limits Moreso than most battery types, lithium cells are not tolerant of mistreatment. Discharging cells below their low voltage limit leads to the formation of copper dendrites, which can reduce cell capacity or short circuit them entirely. Overcharging cells causes damage to the anode by lithium plating out of solution, creating lithium dendrites, often leading to a short circuit or full thermal runaway of the battery, leading to a release of smoke and flames. Each cell in a pack must also be kept at the same voltage as its neighbors, to avoid cells getting damaged prematurely. It’s important not to charge lithium cells too quickly. Ambient temperatures also play a big role in battery performance. Lithium batteries don’t appreciate being taken down below freezing, particularly when they’re already fully charged. Below 0°C, charging is impractical, as meta
- [5] Lithium-ion_battery_-_Wikipedia__275bc48c — wikipedia
source passage
discharge current.[135] Poor internal ventilation may increase temperatures. For large batteries consisting of multiple cells, non-uniform temperatures can lead to non-uniform and accelerated degradation.[136] In contrast, the calendar life of LiFePO Positive SEI layer in lithium-ion batteries is much less understood than the negative SEI. It is believed to have a low-ionic conductivity and shows up as an increased interfacial resistance of the cathode during cycling and calendar aging.[115][116][114] 4 cells is not affected by high charge states.[137][138] – Lithium plating is a phenomenon in which certain conditions lead to metallic lithium forming and depositing onto the surface of the battery's anode rather than intercalating within the anode material's structure. Low temperatures, overcharging and high charging rates can exacerbate this occurrence.[139][140] During these conditions, lithium ions may not intercalate uniformly into the anode material and form layers of lithium ion on the surface in the form of dendrites. Lithium dendrites are tiny needle-like structures that can accumulate and pierce the separator, causing a short circuit can initiate thermal runaway.[115] This cascade of rapid and uncontrolled energy can lead to battery swelling, increased heat, fires and or explosions.[141] Additionally, this dendritic growth can lead to side reactions with the electrolyte and convert the fresh plated lithium into electrochemically inert dead lithium.[142] Moreover, the
- [6] US5367442A_-_Self-contained_solar_powered_lamp_-_Google_Patents__17774f1c — patent
source passage
specified by the manufacturer. At temperatures higher than the operating temperature, the charge acceptance capabilities of the electrical storage device decrease substantially. This is undesirable because sunlight to power the solar cell array is available only during a relatively short period of time each day. The current level generated by the solar cell array when in excess of the charge acceptance of the electrical storage device causes it to overheat and sustain damage, thereby causing the overall performance of the solar powered lamp to deteriorate. In one approach to overcome this problem, the electrical storage device may be arranged remote from the solar cell array. Although this prevents the electrical storage device from absorbing heat generated by the solar cell array, thus, maintaining the operating temperature at a normal level in hot weather, it is not satisfactory during cold weather because the electrical storage device is unable to provide current sufficient to illuminate the bulb at temperatures below its operating temperature. The electrical storage device is therefore typically placed in heat transfer proximity to the solar cell array so that heat absorbed by the solar cell array on a sunny day helps elevate the temperature of the power source to its normal operating temperature even if the ambient temperature is low. Moreover, existing solar lighting devices are configured in a manner which does not provide for the flow of air through the lamp. This fur
- [7] Advances in Lithium-Ion Batteries — book
source passage
Comparison of thermal response as a result of internal short for the two large-format cell designs and (b) Temperature contour profiles for the two cell designs at 10 s, 180 s and 360 s after incurring internal short of anode–cathode kind. Simulations are carried out at 80% SOC for both the designs at. FIGURE 19.5 Thermal infrared image of the C-LiFePO4/C-Li4Ti5O12 18,650-type cell recorded during discharge at 50C: (a) partial discharge to 1.2 V, (b) full discharge to 1.0 V [170]. FIGURE 21.1 Maximum potential US lithium demand and supply from recycling. FIGURE 21.6 Total energy consumption (a), GHG emissions (b), and SOx emissions (c) for the vehicle and fuel cycles of PHEV and BEVs powered by the US and California grids. FIGURE 21.8 Schematic flow chart for the production of lithium-ion cell materials, where purple ovals and light blue rectangles represent component materials and process steps, respectively. The red, yellow, and green symbols next to various components indicate where new materials can be replaced by smelting, by the intermediate process, and by direct recovery, respectively, and the corresponding shaded outlines encompass the process steps that are avoided by each of these alternative flows. FIGURE 21.14 Total (a) estimated energy consumption (MJ/kg battery) and (b) GHG emissions of BEV batteries made from virgin materials (solid black line); with recycled cathode materials; with recycled aluminum; with recycled copper; and with recycled cathode material, c
- [9] Advances in Lithium-Ion Batteries — book
source passage
(1.2 V) and full discharge (1.0 V), and showed that the temperature is less than 40 °C anywhere inside the cell. The same experiment performed during charge at the same C-rate shows that the temperature does not exceed 35 °C anywhere in the cell when the charge is limited to 1.7 V, but increases locally up to 48 °C at full charge (2.1 V) [171]. Moreover, the stability of the cell upon cycling has been tested over 3500 cycles, and confirms that the cell does not age upon cycling, even when submitted to the C-rates of the HPPC test. FIGURE 19.4 Modified Peukert plot of the C-LiFePO4/C-Li4Ti5O12 18,650-type cell [170], together with the cell temperature at various steps of this experiment. (For color version of this figure, the reader is referred to the online version of this book.) FIGURE 19.5 Thermal infrared image of the C-LiFePO4/C-Li4Ti5O12 18,650-type cell recorded during discharge at 50C: (a) partial discharge to 1.2 V, (b) full discharge to 1.0 V [170]. (For color version, refer to the plate section.) However, as we have already pointed out that the LiPF6-based electrolyte suffers above 30 °C, we have tested the LFP/LTO battery with other electrolytes that are stable at higher temperature. Significant improvement has been obtained in particular with the electrolyte 0.5 mol/l LiTFSI + 1 mol/l LiBF4 EC–GBL; we have mentioned in Section 2.2 the remarkable thermal stability of this combination. With this electrolyte, the capacity and modified Peuckert plot are about the same
- [10] The_Battery_Cycle_part_two_Device_lifespan_-_pv_magazine_Global__d3e23578 — magazine
source passage
# The Battery Cycle part two: Device lifespan – pv magazine Global Source: Blog/Web URL: https://www.pv-magazine.com/2023/09/19/the-battery-cycle-part-two-device-lifespan/ Author: Claudius Jehle; Pv Magazine Date: 2023-09-19 Amid wide battery variety, each cell type and sub-species of device has unique vulnerability to degradation, influenced by usage and other factors. Some cells thrive at low temperature, others excel at high currents. Such specialization, however, often comes at a cost. Image: volytica diagnostics GmbH Battery aging is either related to time (in cases of calendar or “calendric” aging) or to usage, with charging and discharging representing “cyclic” aging. Both forms of aging contribute to capacity and efficiency fade and increasing internal resistance as ions become trapped in unpleasant side-reactions for good. These reactions are driven by various “influencing factors.” Typically, ions react irreversibly with other materials in the cell, forming passive residue and preventing their use for energy transport. Common influencing factors – whose impact varies by cell type – include the temperature of battery cells; device state-of-charge (SOC); and the current, or power, used during charging and discharging. Regarding state-of-charge – the amount of charge, or energy, in a battery – idle SOC matters when a battery is not in use and the SOC window (the range in which cycling occurs) is relevant when a device is cycling. Mechanical stress, such as vibration an
- [16] US7433794B1_-_Mitigation_of_propagation_of_thermal_runaway_in__b7e67027 — patent
source passage
dependent on cell chemistry and varies among the different types of cells contemplated for use. – the cells 18 in the energy storage system 12 could be overcharged by the vehicles battery charging system (EVSE) or by the regenerative braking found in the electric vehicle of the present invention. – EVSE vehicles battery charging system – cells 18 may have suffered internal damage and as such may produce heat from internal chemical reactions. This damage may be caused by impact, crushing or heating to temperatures above the thermal runaway threshold of the individual cells 18 . – a high resistant electrical connection may also produce heat by dissipating the energy that passes through it, by proximity this may also heat a nearby cell 18 thus leading to thermal runaway and propagation of such overheated cells. – the high resistance connection may be either internal/external to an individual cell 18 . – external arcing may occur anywhere within the energy storage system 12 and may produce intense heat in the path of the arc. This arcing could happen if two sheets 14 are short circuited in a crash or during any other known arcing phenomenon. – the cells 18 generally have a target operating temperature of approximately 25° C. It should be noted that this temperature reading depends on the system design and chemistry involved in the cells within the electric vehicle. – any known target operating temperature of anywhere between ⁇ 50° C. and 200° C. is contemplated for the present in
- [17] Advances in Lithium-Ion Batteries — book
source passage
surface temperature has reached the steady-state condition. Moreover, the test has been carried out at (80%, 65%, 50%, 35% and 20%) SoC and at the current rates of (10 It, 8 It, 6 It, 4 It). Then, the same test has also been performed at different operating temperatures (40 °C, 25 °C, 10 °C, 0 °C) by using a climate chamber as illustrated in Figure 11.3. This issue will allow to extract the relationship between thermal resistance and thermal capacitance in these conditions. In Figure 11.4, an example of the performed test is proposed whereby the evolutions of voltage and temperature are illustrated. FIGURE 11.2 Implemented microcycle. (For color version of this figure, the reader is referred to the online version of this book.) FIGURE 11.3 The battery of this study in the climate chamber (2.3 Ah). (For color version of this figure, the reader is referred to the online version of this book.) FIGURE 11.4 Voltage and surface temperature evolution during the test at 25 °C. (For color version, refer to the plate section.) In this study, cylindrical lithium iron phosphate-based battery cells have been used with rated capacity of 2.3 Ah and nominal voltage of 3.3 V as presented in Figure 11.3. 4 Model Parameter Extraction 4.1 Heat Convection As reported in the introduction, the development of an accurate thermal model for lithium-ion technology is quite a difficult task due to the many phenomena that occur. However, in [23] it is documented that a thermal model can be proposed by it
- [24] Advances in Lithium-Ion Batteries — book
source passage
the heat generation rate, or (2) increase the heat dissipation rate. Heat is generated by the thermal decomposition and/or reaction of materials in the cell. The heat dissipation rate depends strongly on the size and shape of the cell. FIGURE 20.1 The balance between heat generation and dissipation rates, which describes combustion. Recent studies on exothermic reactions in Li-ion cells are introduced in the following session. 3 Chemical Reduction of the Electrolyte by the Negative Electrode 3.1 Graphite Electrode [6] The results reported here refer to a graphite electrode prepared by mixing 95 wt.% of natural graphite with 5 wt.% of poly(vinylidene fluoride) (PVdF)-binder. Graphite electrodes without PVdF-binder were also fabricated. The electrolyte was 1 M LiPF6/ethylene carbonate (EC) + dimethyl carbonate (DMC) (1:1 v/v) and the counter electrode a Li metal sheet. The cells were cycled between 0.01 and 1.5 V with a relaxation period of 60 min at the end of charge, at a constant current of 0.2 mA/cm2. After two cycles in this condition, the cells were charged to 0 V with the time limit of 372 mAh/g to obtain a fully charged negative electrode. Figure 20.2 shows DSC curves for fully lithiated or delithiated graphite (a–d) and the electrolyte (e). Sample (a) shows a mild heat generation starting at 130 °C with a small peak at 140 °C. The mild heat generation continued until a sharp exothermic peak appeared at 280 °C. From our experiments, the small peak at 140 °C is caused by
by modifying the synthesis conditions, for example, by adding a reducing agent such as ascorbic acid328 to prevent surface ferric films; the hydrothermal method can also produce material with excellent electrochemical behavior even without a carbon coating,329 as is necessary in most instances as discussed below. As this material has a very low conductivity at room temperature, it could achieve the theoretical capacity only at a very low current density315 or at elevated temperatures,317 as suggested by Padhi309 due to the low lithium diffusion at the interface. Ravet et al.318 showed that a carbon coating signifi- cantly improves the electrochemical performance of this material; sucrose was proposed319 as one carbon precursor, and it was used on the initial hydrother- mal samples.50 Many other studies have been made on finding means to improve the electronic conduc- tivity of the LiFePO4 particles.49,198,320,321,323-326 Very pure LiFePO4 samples are reported to have an electronic conductivity of 10-9 S/cm,324 whereas samples made from reagent-grade carbon-containing materials have a conductivity of around 10-5-10-6 S/cm.198 Huang et al.320 proposed coating the material with carbon-gel during the synthesis step and found capacities approaching 100% at very low cathode loadings, 5 mg/cm2, and rather high carbon contents, 20%. They obtained 800 cycles at around 120 mAh/g at high rates. Masquelier proposed321 extensive mill- ing of the material with carbon and then found high ca
batteries. Lithium-Iron-Phosphate, or LiFePO4 batteries are an altered lithium-ion chemistry, which offers the benefits of withstanding more charge/discharge cycles, while losing some energy density in the tradeoff. They operate ideally between 3.0V-3.65V, instead of the more typical 3.0-4.2V range of a standard lithium-ion chemistry. This, combined with a very flat discharge voltage curve, makes them ideal replacements for 12V lead-acid batteries in many applications, where four cells substitute for the original six. They’re generally more stable, with lower rates of self-discharge and capacity loss over time. Respect The Limits Moreso than most battery types, lithium cells are not tolerant of mistreatment. Discharging cells below their low voltage limit leads to the formation of copper dendrites, which can reduce cell capacity or short circuit them entirely. Overcharging cells causes damage to the anode by lithium plating out of solution, creating lithium dendrites, often leading to a short circuit or full thermal runaway of the battery, leading to a release of smoke and flames. Each cell in a pack must also be kept at the same voltage as its neighbors, to avoid cells getting damaged prematurely. It’s important not to charge lithium cells too quickly. Ambient temperatures also play a big role in battery performance. Lithium batteries don’t appreciate being taken down below freezing, particularly when they’re already fully charged. Below 0°C, charging is impractical, as meta
discharge current.[135] Poor internal ventilation may increase temperatures. For large batteries consisting of multiple cells, non-uniform temperatures can lead to non-uniform and accelerated degradation.[136] In contrast, the calendar life of LiFePO Positive SEI layer in lithium-ion batteries is much less understood than the negative SEI. It is believed to have a low-ionic conductivity and shows up as an increased interfacial resistance of the cathode during cycling and calendar aging.[115][116][114] 4 cells is not affected by high charge states.[137][138] – Lithium plating is a phenomenon in which certain conditions lead to metallic lithium forming and depositing onto the surface of the battery's anode rather than intercalating within the anode material's structure. Low temperatures, overcharging and high charging rates can exacerbate this occurrence.[139][140] During these conditions, lithium ions may not intercalate uniformly into the anode material and form layers of lithium ion on the surface in the form of dendrites. Lithium dendrites are tiny needle-like structures that can accumulate and pierce the separator, causing a short circuit can initiate thermal runaway.[115] This cascade of rapid and uncontrolled energy can lead to battery swelling, increased heat, fires and or explosions.[141] Additionally, this dendritic growth can lead to side reactions with the electrolyte and convert the fresh plated lithium into electrochemically inert dead lithium.[142] Moreover, the
specified by the manufacturer. At temperatures higher than the operating temperature, the charge acceptance capabilities of the electrical storage device decrease substantially. This is undesirable because sunlight to power the solar cell array is available only during a relatively short period of time each day. The current level generated by the solar cell array when in excess of the charge acceptance of the electrical storage device causes it to overheat and sustain damage, thereby causing the overall performance of the solar powered lamp to deteriorate. In one approach to overcome this problem, the electrical storage device may be arranged remote from the solar cell array. Although this prevents the electrical storage device from absorbing heat generated by the solar cell array, thus, maintaining the operating temperature at a normal level in hot weather, it is not satisfactory during cold weather because the electrical storage device is unable to provide current sufficient to illuminate the bulb at temperatures below its operating temperature. The electrical storage device is therefore typically placed in heat transfer proximity to the solar cell array so that heat absorbed by the solar cell array on a sunny day helps elevate the temperature of the power source to its normal operating temperature even if the ambient temperature is low. Moreover, existing solar lighting devices are configured in a manner which does not provide for the flow of air through the lamp. This fur
Comparison of thermal response as a result of internal short for the two large-format cell designs and (b) Temperature contour profiles for the two cell designs at 10 s, 180 s and 360 s after incurring internal short of anode–cathode kind. Simulations are carried out at 80% SOC for both the designs at. FIGURE 19.5 Thermal infrared image of the C-LiFePO4/C-Li4Ti5O12 18,650-type cell recorded during discharge at 50C: (a) partial discharge to 1.2 V, (b) full discharge to 1.0 V [170]. FIGURE 21.1 Maximum potential US lithium demand and supply from recycling. FIGURE 21.6 Total energy consumption (a), GHG emissions (b), and SOx emissions (c) for the vehicle and fuel cycles of PHEV and BEVs powered by the US and California grids. FIGURE 21.8 Schematic flow chart for the production of lithium-ion cell materials, where purple ovals and light blue rectangles represent component materials and process steps, respectively. The red, yellow, and green symbols next to various components indicate where new materials can be replaced by smelting, by the intermediate process, and by direct recovery, respectively, and the corresponding shaded outlines encompass the process steps that are avoided by each of these alternative flows. FIGURE 21.14 Total (a) estimated energy consumption (MJ/kg battery) and (b) GHG emissions of BEV batteries made from virgin materials (solid black line); with recycled cathode materials; with recycled aluminum; with recycled copper; and with recycled cathode material, c
(1.2 V) and full discharge (1.0 V), and showed that the temperature is less than 40 °C anywhere inside the cell. The same experiment performed during charge at the same C-rate shows that the temperature does not exceed 35 °C anywhere in the cell when the charge is limited to 1.7 V, but increases locally up to 48 °C at full charge (2.1 V) [171]. Moreover, the stability of the cell upon cycling has been tested over 3500 cycles, and confirms that the cell does not age upon cycling, even when submitted to the C-rates of the HPPC test. FIGURE 19.4 Modified Peukert plot of the C-LiFePO4/C-Li4Ti5O12 18,650-type cell [170], together with the cell temperature at various steps of this experiment. (For color version of this figure, the reader is referred to the online version of this book.) FIGURE 19.5 Thermal infrared image of the C-LiFePO4/C-Li4Ti5O12 18,650-type cell recorded during discharge at 50C: (a) partial discharge to 1.2 V, (b) full discharge to 1.0 V [170]. (For color version, refer to the plate section.) However, as we have already pointed out that the LiPF6-based electrolyte suffers above 30 °C, we have tested the LFP/LTO battery with other electrolytes that are stable at higher temperature. Significant improvement has been obtained in particular with the electrolyte 0.5 mol/l LiTFSI + 1 mol/l LiBF4 EC–GBL; we have mentioned in Section 2.2 the remarkable thermal stability of this combination. With this electrolyte, the capacity and modified Peuckert plot are about the same
# The Battery Cycle part two: Device lifespan – pv magazine Global Source: Blog/Web URL: https://www.pv-magazine.com/2023/09/19/the-battery-cycle-part-two-device-lifespan/ Author: Claudius Jehle; Pv Magazine Date: 2023-09-19 Amid wide battery variety, each cell type and sub-species of device has unique vulnerability to degradation, influenced by usage and other factors. Some cells thrive at low temperature, others excel at high currents. Such specialization, however, often comes at a cost. Image: volytica diagnostics GmbH Battery aging is either related to time (in cases of calendar or “calendric” aging) or to usage, with charging and discharging representing “cyclic” aging. Both forms of aging contribute to capacity and efficiency fade and increasing internal resistance as ions become trapped in unpleasant side-reactions for good. These reactions are driven by various “influencing factors.” Typically, ions react irreversibly with other materials in the cell, forming passive residue and preventing their use for energy transport. Common influencing factors – whose impact varies by cell type – include the temperature of battery cells; device state-of-charge (SOC); and the current, or power, used during charging and discharging. Regarding state-of-charge – the amount of charge, or energy, in a battery – idle SOC matters when a battery is not in use and the SOC window (the range in which cycling occurs) is relevant when a device is cycling. Mechanical stress, such as vibration an
dependent on cell chemistry and varies among the different types of cells contemplated for use. – the cells 18 in the energy storage system 12 could be overcharged by the vehicles battery charging system (EVSE) or by the regenerative braking found in the electric vehicle of the present invention. – EVSE vehicles battery charging system – cells 18 may have suffered internal damage and as such may produce heat from internal chemical reactions. This damage may be caused by impact, crushing or heating to temperatures above the thermal runaway threshold of the individual cells 18 . – a high resistant electrical connection may also produce heat by dissipating the energy that passes through it, by proximity this may also heat a nearby cell 18 thus leading to thermal runaway and propagation of such overheated cells. – the high resistance connection may be either internal/external to an individual cell 18 . – external arcing may occur anywhere within the energy storage system 12 and may produce intense heat in the path of the arc. This arcing could happen if two sheets 14 are short circuited in a crash or during any other known arcing phenomenon. – the cells 18 generally have a target operating temperature of approximately 25° C. It should be noted that this temperature reading depends on the system design and chemistry involved in the cells within the electric vehicle. – any known target operating temperature of anywhere between ⁇ 50° C. and 200° C. is contemplated for the present in
surface temperature has reached the steady-state condition. Moreover, the test has been carried out at (80%, 65%, 50%, 35% and 20%) SoC and at the current rates of (10 It, 8 It, 6 It, 4 It). Then, the same test has also been performed at different operating temperatures (40 °C, 25 °C, 10 °C, 0 °C) by using a climate chamber as illustrated in Figure 11.3. This issue will allow to extract the relationship between thermal resistance and thermal capacitance in these conditions. In Figure 11.4, an example of the performed test is proposed whereby the evolutions of voltage and temperature are illustrated. FIGURE 11.2 Implemented microcycle. (For color version of this figure, the reader is referred to the online version of this book.) FIGURE 11.3 The battery of this study in the climate chamber (2.3 Ah). (For color version of this figure, the reader is referred to the online version of this book.) FIGURE 11.4 Voltage and surface temperature evolution during the test at 25 °C. (For color version, refer to the plate section.) In this study, cylindrical lithium iron phosphate-based battery cells have been used with rated capacity of 2.3 Ah and nominal voltage of 3.3 V as presented in Figure 11.3. 4 Model Parameter Extraction 4.1 Heat Convection As reported in the introduction, the development of an accurate thermal model for lithium-ion technology is quite a difficult task due to the many phenomena that occur. However, in [23] it is documented that a thermal model can be proposed by it
the heat generation rate, or (2) increase the heat dissipation rate. Heat is generated by the thermal decomposition and/or reaction of materials in the cell. The heat dissipation rate depends strongly on the size and shape of the cell. FIGURE 20.1 The balance between heat generation and dissipation rates, which describes combustion. Recent studies on exothermic reactions in Li-ion cells are introduced in the following session. 3 Chemical Reduction of the Electrolyte by the Negative Electrode 3.1 Graphite Electrode [6] The results reported here refer to a graphite electrode prepared by mixing 95 wt.% of natural graphite with 5 wt.% of poly(vinylidene fluoride) (PVdF)-binder. Graphite electrodes without PVdF-binder were also fabricated. The electrolyte was 1 M LiPF6/ethylene carbonate (EC) + dimethyl carbonate (DMC) (1:1 v/v) and the counter electrode a Li metal sheet. The cells were cycled between 0.01 and 1.5 V with a relaxation period of 60 min at the end of charge, at a constant current of 0.2 mA/cm2. After two cycles in this condition, the cells were charged to 0 V with the time limit of 372 mAh/g to obtain a fully charged negative electrode. Figure 20.2 shows DSC curves for fully lithiated or delithiated graphite (a–d) and the electrolyte (e). Sample (a) shows a mild heat generation starting at 130 °C with a small peak at 140 °C. The mild heat generation continued until a sharp exothermic peak appeared at 280 °C. From our experiments, the small peak at 140 °C is caused by